Red Rock Resorts (RRR) Earnings Growth And 9.3% Margin Test Bullish Narratives
Red Rock Resorts, Inc. Class A RRR | 55.04 | +0.15% |
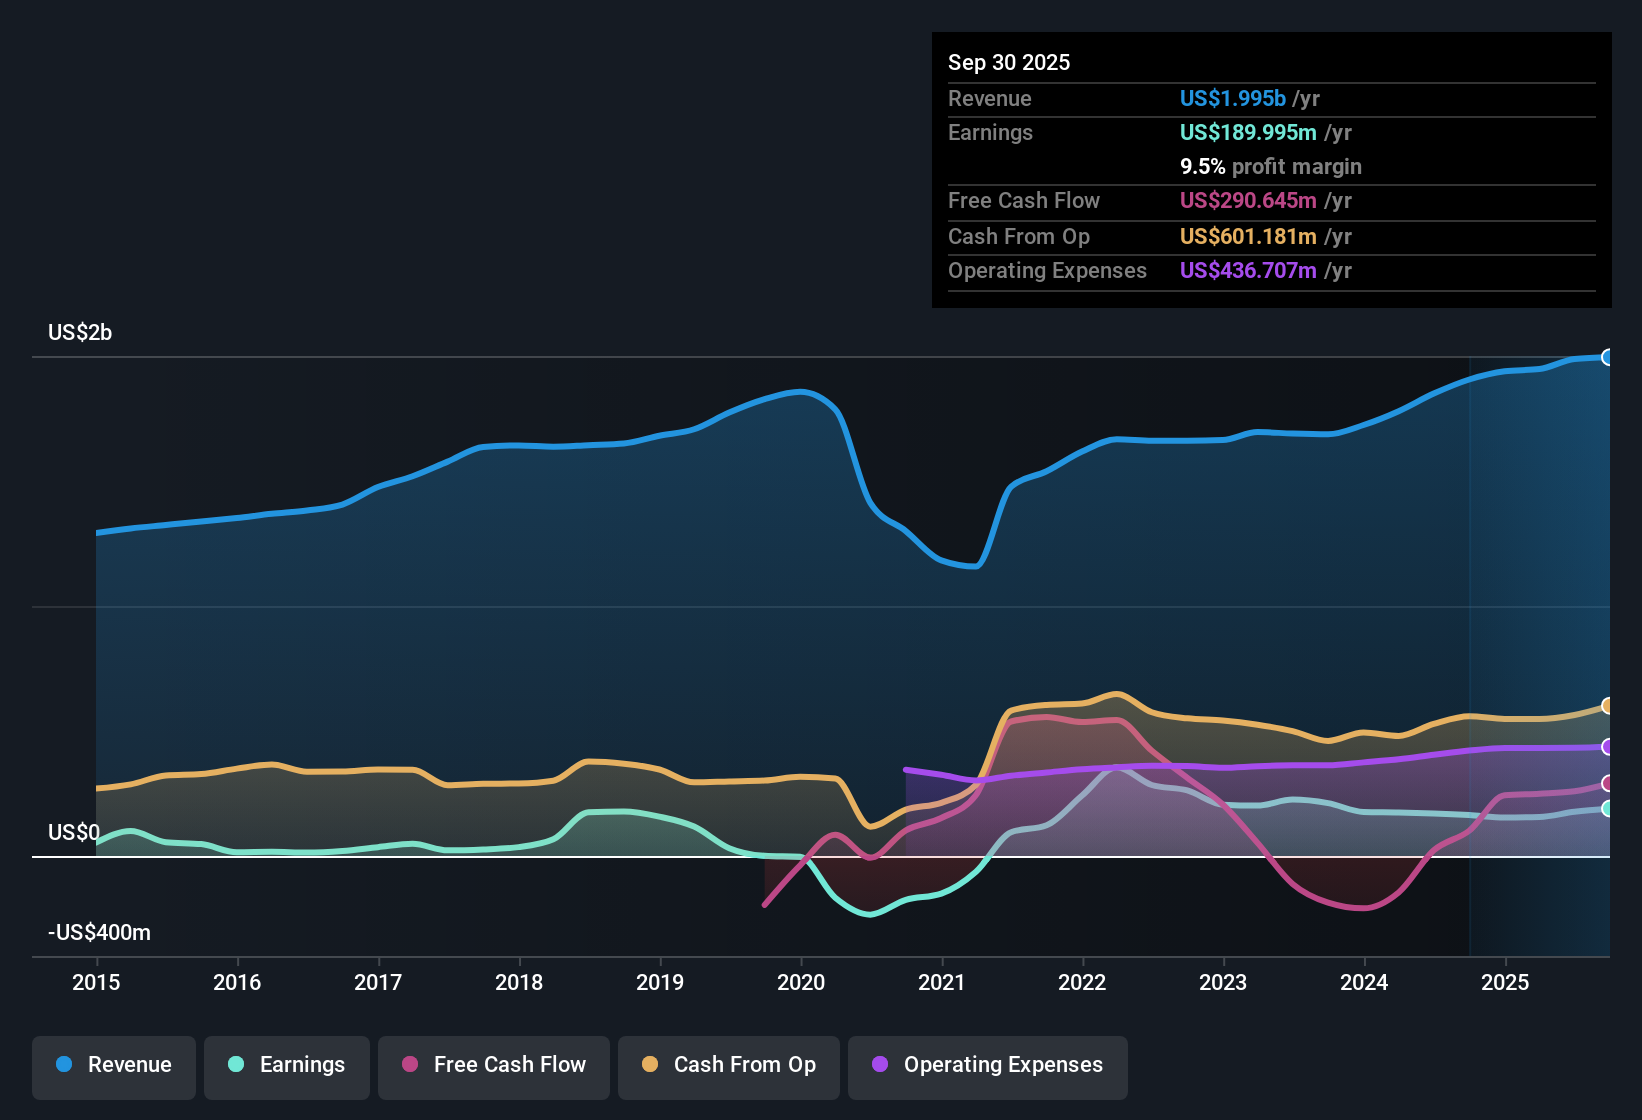
Red Rock Resorts (RRR) closed FY 2025 with Q4 revenue of US$511.8 million and basic EPS of US$0.76, with trailing twelve month EPS at US$3.19 and revenue at about US$2.0 billion framing the full year picture. Over recent quarters the company has seen revenue move from US$495.7 million in Q4 2024 to US$526.3 million in Q2 2025 and EPS range between US$0.49 in Q3 2024 and US$0.96 in Q2 2025, giving investors a clear view of how the top and bottom line have tracked into the latest print. With trailing net margin at 9.3% and earnings growth of 22.1% over the past year, the results put profitability and earnings momentum firmly in focus for investors assessing the current update.
See our full analysis for Red Rock Resorts.With the numbers on the table, the next step is to see how this earnings profile lines up with the most common narratives around Red Rock Resorts, highlighting where the story is reinforced and where it might need a rethink.
Margins Backed By US$188.1 Million In TTM Net Income
- Over the last twelve months, Red Rock Resorts generated US$188.1 million in net income on US$2.0b of revenue, which lines up with the 9.3% net margin figure you saw earlier.
- Analysts' consensus view talks about upgraded properties and newer amenities supporting higher margins, and the current numbers partly back that up while also setting a hurdle:
- TTM net income of US$188.1 million compares with the consensus assumption of earnings reaching US$249.6 million by 2028. The business already sits on a sizeable profit base that would need to grow further to match that view.
- With revenue at about US$2.0b today versus a consensus revenue target of US$2.2b for 2028, the consensus case effectively leans on both some revenue expansion and higher margins to do the heavy lifting.
22.1% Earnings Growth Versus 3.9% Revenue Forecast
- Earnings grew 22.1% over the past year, while revenue is forecast to grow around 3.9% per year, which suggests recent profit gains have leaned more on margins than on rapid top line expansion.
- Bulls argue that local population growth and new properties like Durango can keep revenue and earnings expanding, and the current figures both support and stretch that claim:
- The five year annualized earnings growth rate of 11.8% gives some history behind the 22.1% latest year figure. Bullish investors may see this as consistent with the idea of a growing Las Vegas locals market.
- At the same time, the 3.9% revenue growth forecast is much lower than the earnings growth rates cited, so a bullish view needs confidence that margin improvements or mix effects can keep doing more of the work than pure sales growth.
Bulls say the recent 22.1% earnings growth is just the start, while skeptics question how far margin gains can really go, so it can be useful to see how that argument plays out in the full bullish case for the company. 🐂 Red Rock Resorts Bull Case
Debt Coverage Concerns Beside A 20.4x P/E
- The shares trade on a trailing P/E of 20.4x, below both the US Hospitality industry average of 21.8x and the peer average of 27.7x, even though debt is flagged as not well covered by operating cash flow.
- Bears focus on that leverage risk and heavy capex needs, and the current data gives them meaningful support as well as one challenge:
- The weak debt coverage by operating cash flow directly echoes concerns about ongoing and upcoming property projects tying up cash and potentially weighing on free cash generation, which matters even if earnings are currently positive.
- On the other hand, a P/E below peers combined with earnings growth of 22.1% in the last year and a DCF fair value of about US$148 versus a US$64.87 share price suggests that valuation metrics do not obviously price in severe long term damage from that leverage risk.
Skeptics point to debt coverage and big project spending as key pressure points, so if you are weighing that side of the story, it helps to see how the more cautious narrative frames those risks in detail. 🐻 Red Rock Resorts Bear Case
Next Steps
To see how these results tie into long-term growth, risks, and valuation, check out the full range of community narratives for Red Rock Resorts on Simply Wall St. Add the company to your watchlist or portfolio so you'll be alerted when the story evolves.
See the numbers differently? If this update sparks a different view, shape your own take in just a few minutes and share it with the community. Do it your way
A great starting point for your Red Rock Resorts research is our analysis highlighting 3 key rewards and 2 important warning signs that could impact your investment decision.
Explore Alternatives
Red Rock Resorts’ heavy reliance on margin-driven earnings growth, combined with concerns about weak debt coverage and sizeable project spending, may leave you looking for sturdier balance sheets.
If you want ideas that try to sidestep that kind of pressure, check out our solid balance sheet and fundamentals stocks screener (45 results) to quickly zero in on companies with stronger financial footing today.
This article by Simply Wall St is general in nature. We provide commentary based on historical data and analyst forecasts only using an unbiased methodology and our articles are not intended to be financial advice. It does not constitute a recommendation to buy or sell any stock, and does not take account of your objectives, or your financial situation. We aim to bring you long-term focused analysis driven by fundamental data. Note that our analysis may not factor in the latest price-sensitive company announcements or qualitative material. Simply Wall St has no position in any stocks mentioned.