
Please use a PC Browser to access Register-Tadawul
Get It
Returns On Capital At National Presto Industries (NYSE:NPK) Have Stalled
National Presto Industries, Inc. NPK | 121.69 121.69 | +1.06% 0.00% Pre |
If we want to find a potential multi-bagger, often there are underlying trends that can provide clues. Firstly, we'll want to see a proven return on capital employed (ROCE) that is increasing, and secondly, an expanding base of capital employed. Ultimately, this demonstrates that it's a business that is reinvesting profits at increasing rates of return. Having said that, from a first glance at National Presto Industries (NYSE:NPK) we aren't jumping out of our chairs at how returns are trending, but let's have a deeper look.
For those who don't know, ROCE is a measure of a company's yearly pre-tax profit (its return), relative to the capital employed in the business. Analysts use this formula to calculate it for National Presto Industries:
Return on Capital Employed = Earnings Before Interest and Tax (EBIT) ÷ (Total Assets - Current Liabilities)
0.12 = US$48m ÷ (US$504m - US$113m) (Based on the trailing twelve months to September 2025).
So, National Presto Industries has an ROCE of 12%. That's a relatively normal return on capital, and it's around the 11% generated by the Aerospace & Defense industry.
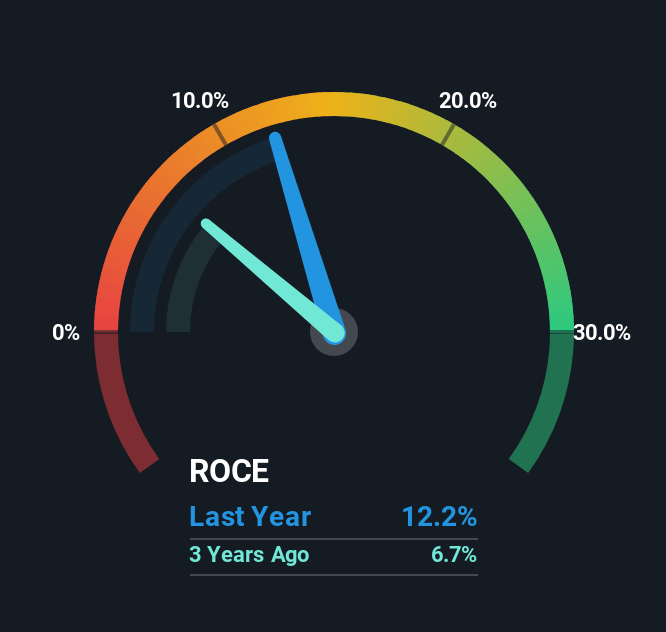
Historical performance is a great place to start when researching a stock so above you can see the gauge for National Presto Industries' ROCE against it's prior returns. If you'd like to look at how National Presto Industries has performed in the past in other metrics, you can view this free graph of National Presto Industries' past earnings, revenue and cash flow.
Over the past five years, National Presto Industries' ROCE and capital employed have both remained mostly flat. This tells us the company isn't reinvesting in itself, so it's plausible that it's past the growth phase. So unless we see a substantial change at National Presto Industries in terms of ROCE and additional investments being made, we wouldn't hold our breath on it being a multi-bagger.
On another note, while the change in ROCE trend might not scream for attention, it's interesting that the current liabilities have actually gone up over the last five years. This is intriguing because if current liabilities hadn't increased to 22% of total assets, this reported ROCE would probably be less than12% because total capital employed would be higher.The 12% ROCE could be even lower if current liabilities weren't 22% of total assets, because the the formula would show a larger base of total capital employed. With that in mind, just be wary if this ratio increases in the future, because if it gets particularly high, this brings with it some new elements of risk.
In a nutshell, National Presto Industries has been trudging along with the same returns from the same amount of capital over the last five years. Although the market must be expecting these trends to improve because the stock has gained 58% over the last five years. However, unless these underlying trends turn more positive, we wouldn't get our hopes up too high.
If you'd like to know about the risks facing National Presto Industries, we've discovered 2 warning signs that you should be aware of.
This article by Simply Wall St is general in nature. We provide commentary based on historical data and analyst forecasts only using an unbiased methodology and our articles are not intended to be financial advice. It does not constitute a recommendation to buy or sell any stock, and does not take account of your objectives, or your financial situation. We aim to bring you long-term focused analysis driven by fundamental data. Note that our analysis may not factor in the latest price-sensitive company announcements or qualitative material. Simply Wall St has no position in any stocks mentioned.
