Robinhood Markets Full Year 2024 Earnings: Beats Expectations
Robinhood HOOD | 0.00 |
Robinhood Markets (NASDAQ:HOOD) Full Year 2024 Results
Key Financial Results
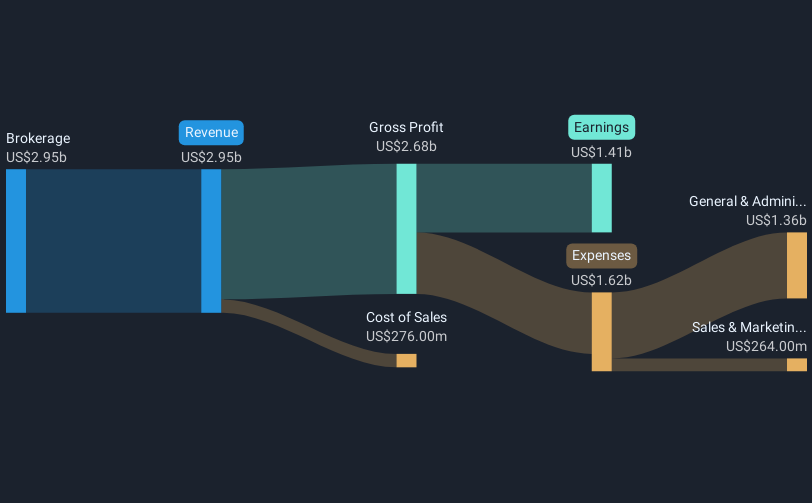
- Revenue: US$2.95b (up 58% from FY 2023).
- Net income: US$1.41b (up from US$541.0m loss in FY 2023).
- Profit margin: 48% (up from net loss in FY 2023). The move to profitability was primarily driven by higher revenue.
- EPS: US$1.60 (up from US$0.61 loss in FY 2023).
All figures shown in the chart above are for the trailing 12 month (TTM) period
Robinhood Markets Revenues and Earnings Beat Expectations
Revenue exceeded analyst estimates by 3.3%. Earnings per share (EPS) also surpassed analyst estimates by 59%.
In the last 12 months, the only revenue segment was Brokerage contributing US$2.95b. The largest operating expense was General & Administrative costs, amounting to US$1.36b (107% of total expenses). Explore how HOOD's revenue and expenses shape its earnings.
Looking ahead, revenue is forecast to grow 11% p.a. on average during the next 3 years, compared to a 5.7% growth forecast for the Capital Markets industry in the US.
The company's shares are up 17% from a week ago.
Risk Analysis
This article by Simply Wall St is general in nature. We provide commentary based on historical data and analyst forecasts only using an unbiased methodology and our articles are not intended to be financial advice. It does not constitute a recommendation to buy or sell any stock, and does not take account of your objectives, or your financial situation. We aim to bring you long-term focused analysis driven by fundamental data. Note that our analysis may not factor in the latest price-sensitive company announcements or qualitative material. Simply Wall St has no position in any stocks mentioned.