Schneider National (SNDR) Margin Compression To 1.8% Tests Bullish Earnings Growth Narrative
Schneider National, Inc. Class B SNDR | 27.44 27.44 | +0.59% 0.00% Post |
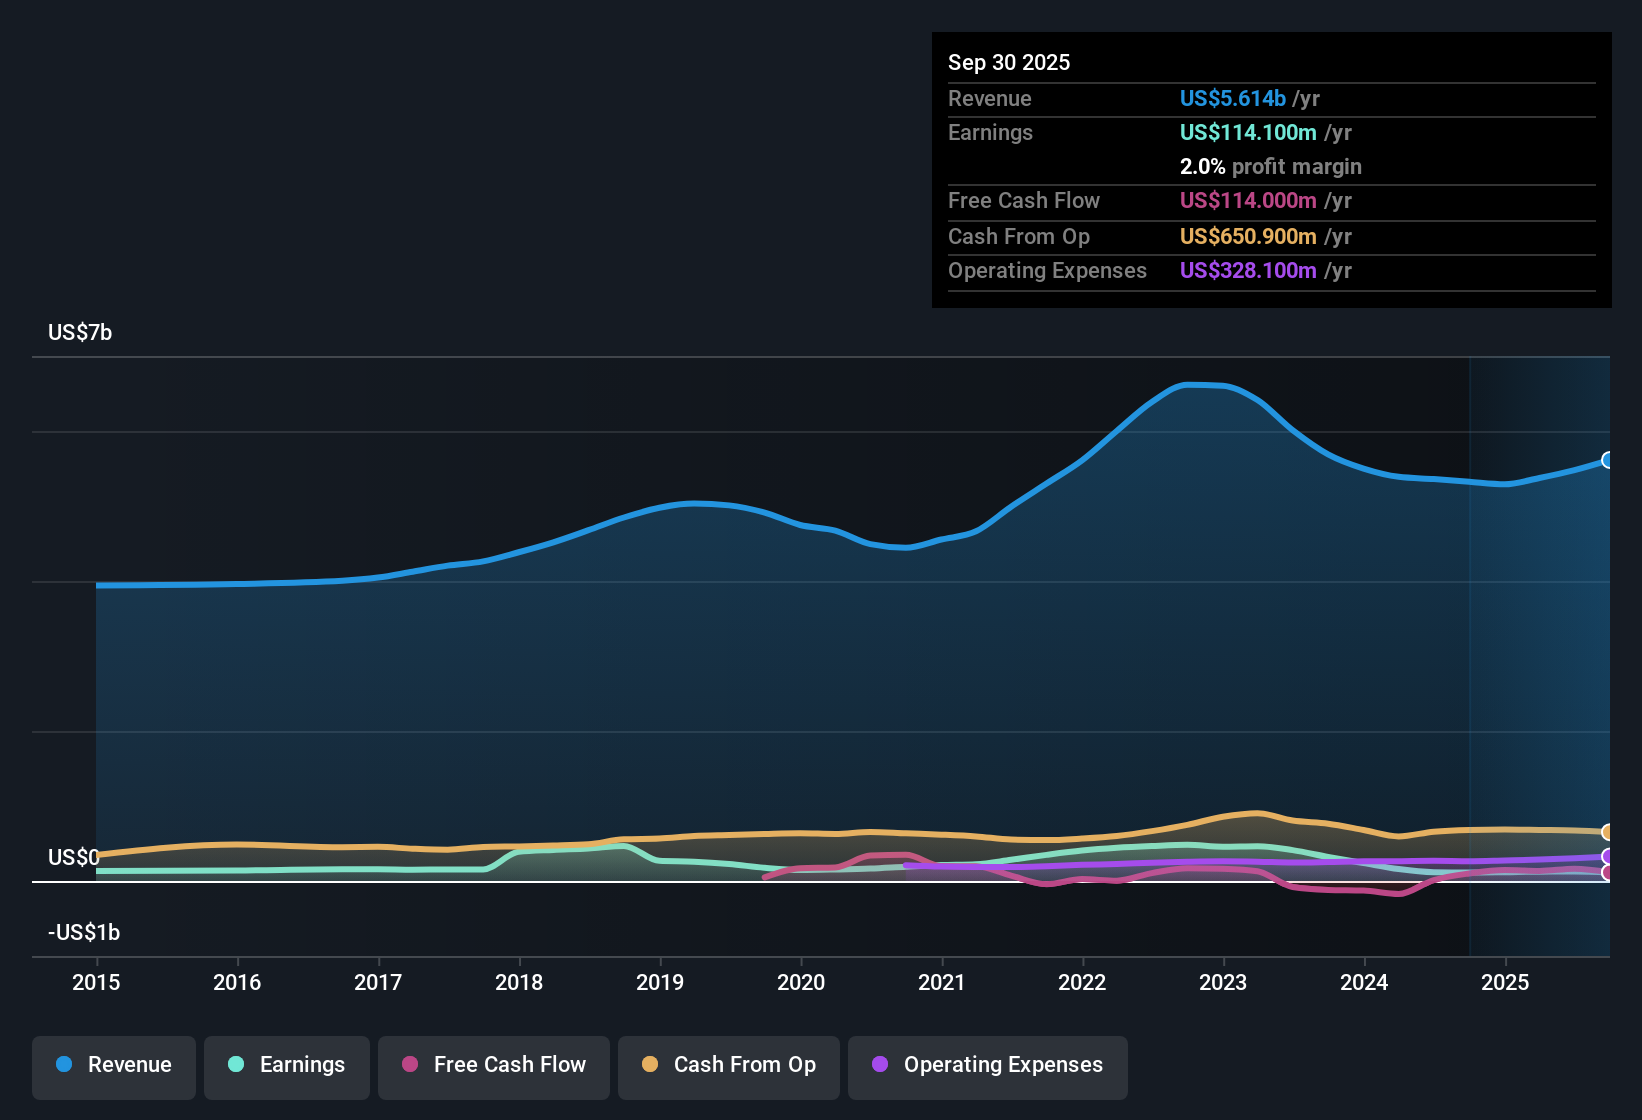
Schneider National (SNDR) has wrapped up FY 2025 with fourth quarter revenue of US$1.4 billion and basic EPS of US$0.13, alongside net income of US$22.1 million. This sets the tone for a year where trailing twelve month revenue reached US$5.7 billion and EPS came in at US$0.59. Over recent quarters the company has reported revenue in a range between US$1.3 billion and US$1.5 billion, with quarterly EPS moving between roughly US$0.11 and US$0.21. For investors, the key question now is how sustainably Schneider can translate that earnings profile into healthier, more consistent margins.
See our full analysis for Schneider National.With the numbers on the table, the next step is to set these results against the widely followed narratives around Schneider National to see which views the data supports and which ones start to look stretched.
Margins Thin With 1.8% Net Profit
- On a trailing basis, Schneider earned US$103.6 million on US$5.7b of revenue, which works out to a 1.8% net margin compared with 2.2% a year earlier.
- What stands out for a bullish view is that forecasts call for earnings to grow about 42.7% per year even though recent margins are tight, so any improvement from the current 1.8% level could have an outsized impact on profit relative to the revenue base.
- Supporters of the bullish case may point to the gap between modest 4.8% expected revenue growth and the much faster earnings growth as a sign that margin efficiency is a key lever.
- The fact that trailing earnings over five years have contracted by about 21.4% per year, despite revenue moving to roughly US$5.7b on a trailing basis, means the bullish thesis leans heavily on a reversal of that profitability pattern.
P/E Of 45.4x Versus Industry 32.4x
- Schneider’s trailing P/E sits at 45.4x, higher than the US Transportation industry average of 32.4x but below the cited peer average of 60.7x, while the current share price is US$26.84.
- Bears focus on this richer multiple relative to the broader transportation group and argue that it sits awkwardly beside trailing margins of 1.8% and a five year earnings contraction of about 21.4% per year.
- The combination of a 45.4x P/E and 1.8% net margin means investors are currently paying a relatively high price for each dollar of compressed profit compared with the wider industry.
- At the same time, earnings forecasts of 42.7% growth per year create tension for the bearish view, because if that growth materializes it could eventually make today’s multiple look less stretched against those higher earnings.
DCF Fair Value Far Above US$26.84 Price
- The stock trades at US$26.84 compared with a DCF fair value of about US$69.79, implying the market price sits roughly 61.5% below that model estimate.
- Supporters of a bullish stance often highlight this wide gap as a potential opportunity, but it sits alongside slower 4.8% expected revenue growth and a trailing net margin that has moved from 2.2% to 1.8%. This means the reward story is closely tied to the company delivering on the 42.7% annual earnings growth outlook.
- The wide gap between the DCF fair value and the share price lines up with the idea that the market is pricing in the weaker recent earnings history more heavily than the strong forward growth forecast.
- Because revenue expectations are for only mid single digit annual growth, the difference between the current share price and the DCF fair value is likely to be most sensitive to changes in profitability rather than large shifts in the top line.
Next Steps
Don't just look at this quarter; the real story is in the long-term trend. We've done an in-depth analysis on Schneider National's growth and its valuation to see if today's price is a bargain. Add the company to your watchlist or portfolio now so you don't miss the next big move.
See What Else Is Out There
Schneider National is working with a thin 1.8% net margin and a five year earnings contraction, while trading on a richer 45.4x P/E.
If a stretched valuation on fragile profitability makes you uneasy, use our these 868 undervalued stocks based on cash flows to quickly focus on companies where pricing lines up more closely with earnings power.
This article by Simply Wall St is general in nature. We provide commentary based on historical data and analyst forecasts only using an unbiased methodology and our articles are not intended to be financial advice. It does not constitute a recommendation to buy or sell any stock, and does not take account of your objectives, or your financial situation. We aim to bring you long-term focused analysis driven by fundamental data. Note that our analysis may not factor in the latest price-sensitive company announcements or qualitative material. Simply Wall St has no position in any stocks mentioned.