
Please use a PC Browser to access Register-Tadawul
Get It
Shoe Carnival (SCVL) Q3: Same-Store Sales Decline Narrows, Challenging Bearish Demand Narrative
Shoe Carnival, Inc. SCVL | 21.28 | +3.91% |
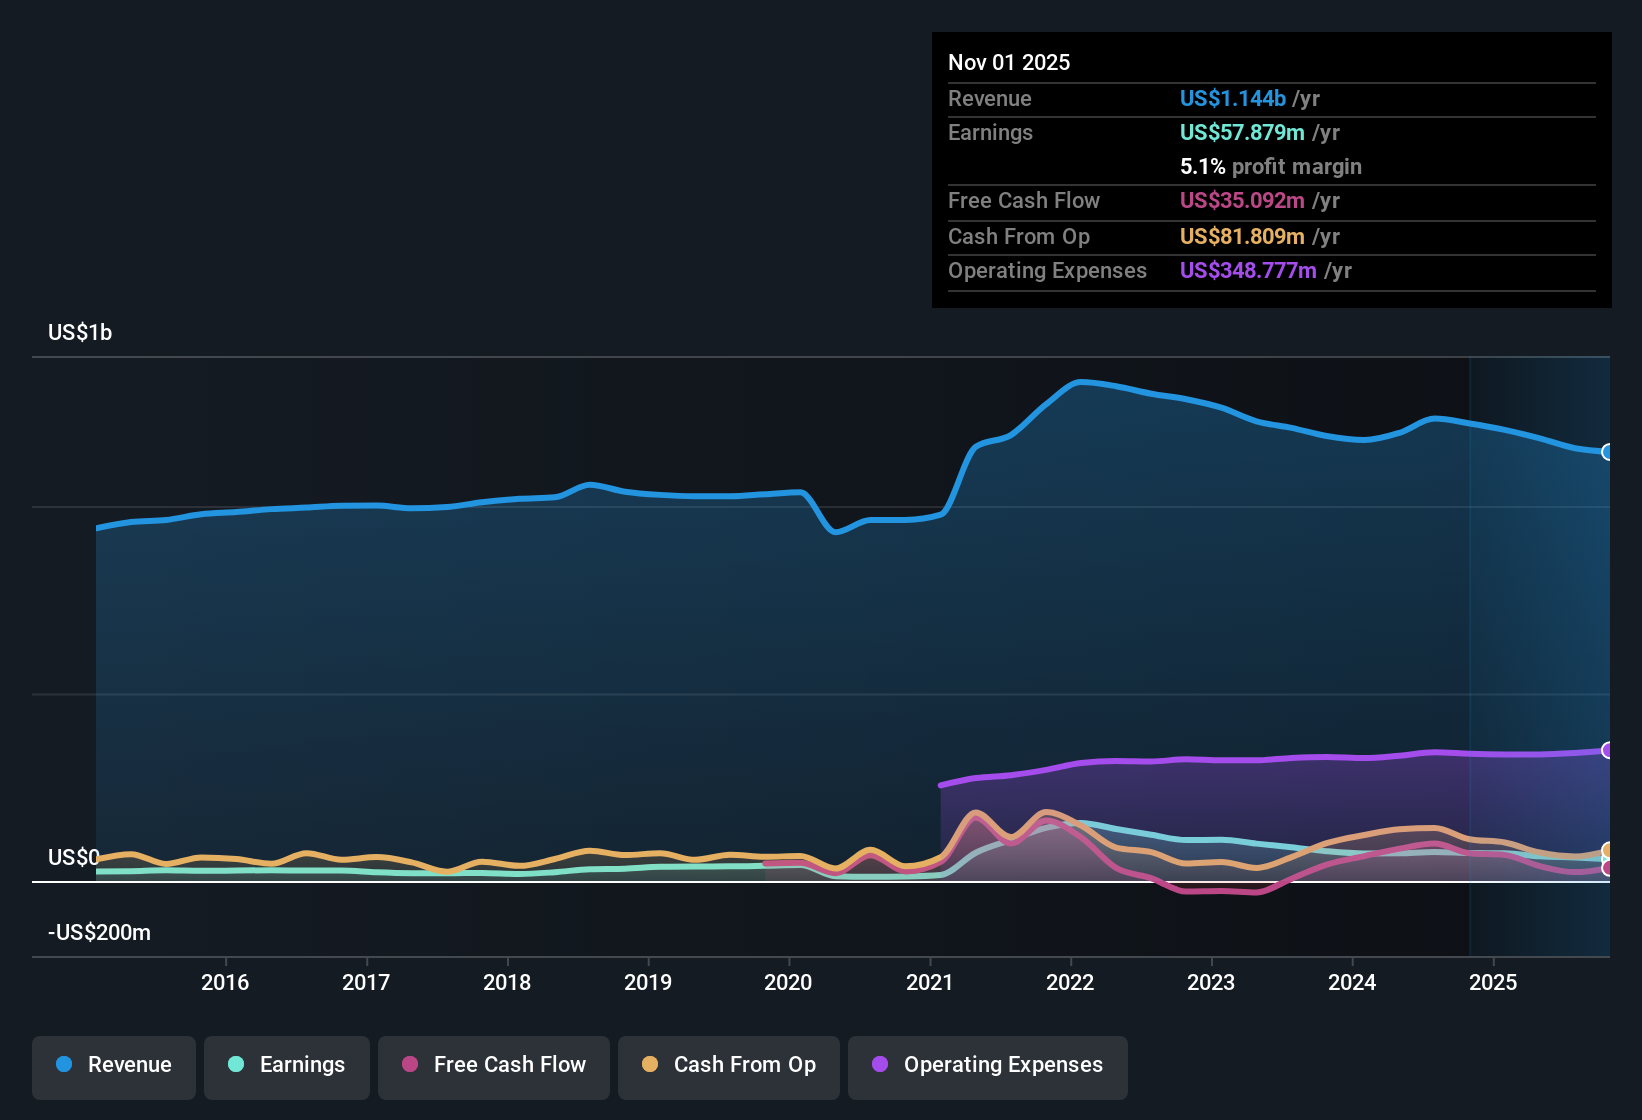
Shoe Carnival (SCVL) just posted Q3 2026 results with revenue of about $297 million and EPS of roughly $0.54, while net income came in at around $14.6 million and same store sales growth was a negative 2.7%, setting a cautious tone for the quarter. The company has seen quarterly revenue move from about $306.9 million and EPS of roughly $0.71 in Q3 2025 to $297.2 million and $0.54 in Q3 2026, with trailing 12 month revenue holding just above $1.1 billion and EPS a little over $2.12, so investors are likely to focus on how management defends margins as they weigh the latest print against future growth potential.
See our full analysis for Shoe Carnival.With the numbers on the table, the next step is to see how this earnings picture lines up against the most popular narratives around Shoe Carnival, highlighting where the story is confirmed and where expectations might need a reset.
To see how these results tie into long-term growth, risks, and valuation, check out the full range of community narratives for Shoe Carnival on Simply Wall St. Add the company to your watchlist or portfolio so you'll be alerted when the story evolves.
See the numbers differently? Use your own take on the data to build a concise, personalised narrative in just a few minutes, Do it your way.
A great starting point for your Shoe Carnival research is our analysis highlighting 3 key rewards and 1 important warning sign that could impact your investment decision.
Shoe Carnival’s negative comparable sales, sliding margins, and forecast earnings declines highlight a business facing pressured demand, discounting, and limited growth visibility.
If you want steadier performers instead, use our stable growth stocks screener (2089 results) to quickly focus on companies with more consistent revenue and earnings trends that better support long term confidence.
This article by Simply Wall St is general in nature. We provide commentary based on historical data and analyst forecasts only using an unbiased methodology and our articles are not intended to be financial advice. It does not constitute a recommendation to buy or sell any stock, and does not take account of your objectives, or your financial situation. We aim to bring you long-term focused analysis driven by fundamental data. Note that our analysis may not factor in the latest price-sensitive company announcements or qualitative material. Simply Wall St has no position in any stocks mentioned.
