
Please use a PC Browser to access Register-Tadawul
Get It
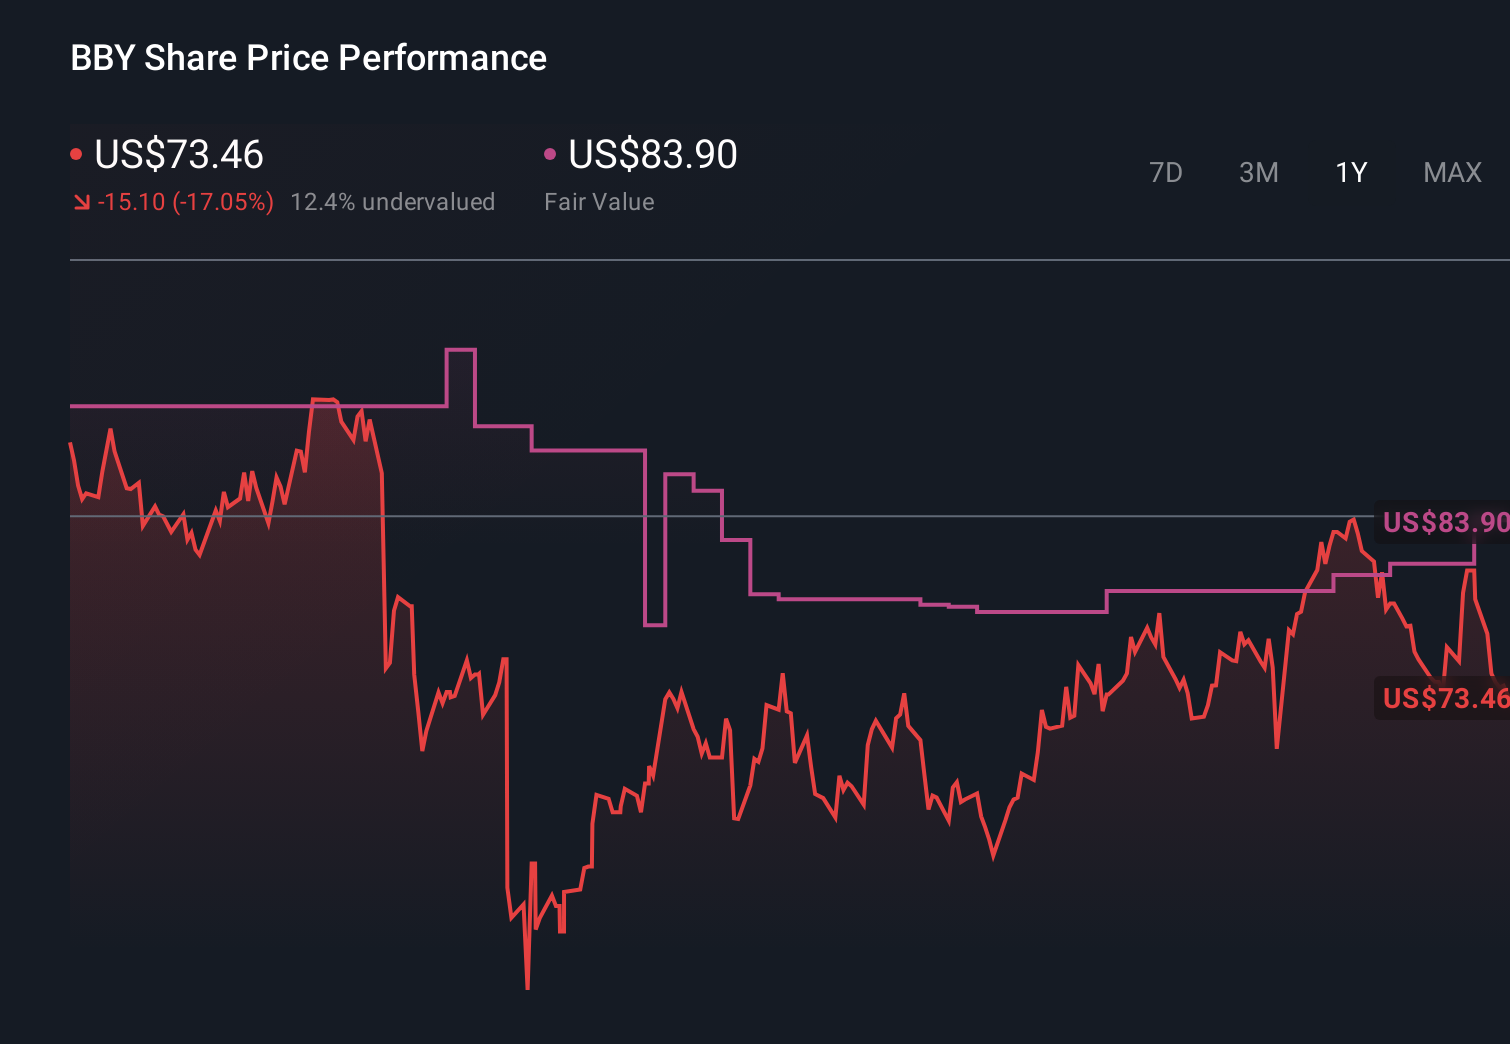
Should Best Buy’s Raised EPS Guidance and Stronger Tech Sales Require Action From Best Buy (BBY) Investors?
Best Buy Co.,Inc. BBY | 64.48 | -2.75% |
Uncover the next big thing with 28 elite penny stocks that balance risk and reward.
To own Best Buy, you need to believe its mix of in-store expertise, services, and core electronics categories can still support solid earnings, even as online competition and pricing pressure weigh on margins. The latest quarter’s better-than-expected sales and higher fiscal 2026 EPS guidance help the near term catalyst around the computing and gaming upgrade cycle, but they do not remove the key risk that a greater tilt toward lower margin categories could constrain profit rates.
Among recent announcements, the updated fiscal 2026 revenue and comparable sales guidance on November 25 is most relevant. Management now sees revenue of US$41.65 billion to US$41.95 billion and comparable sales growth of 0.5% to 1.2%, which ties directly into the thesis that upcoming computing and mobile refreshes, plus attached services, are the primary drivers for any improvement in earnings power.
Yet beneath the stronger outlook, investors should be aware of how a sustained shift toward lower margin product mix could...
Best Buy's narrative projects $44.5 billion revenue and $1.5 billion earnings by 2028. This requires 2.3% yearly revenue growth and a $722.0 million earnings increase from $778.0 million today.
Uncover how Best Buy's forecasts yield a $82.38 fair value, a 23% upside to its current price.
Before this report, the most optimistic analysts already assumed revenue climbing toward about US$45.2 billion and earnings near US$1.6 billion, so if you lean toward that view, the Q3 beat and raised guidance may either reinforce your belief in stronger omnichannel and marketplace driven growth or prompt you to reassess how much tariff and cost risks could still derail that path.
Explore 6 other fair value estimates on Best Buy - why the stock might be worth 21% less than the current price!
Disagree with existing narratives? Create your own in under 3 minutes - extraordinary investment returns rarely come from following the herd.
The market won't wait. These fast-moving stocks are hot now. Grab the list before they run:
This article by Simply Wall St is general in nature. We provide commentary based on historical data and analyst forecasts only using an unbiased methodology and our articles are not intended to be financial advice. It does not constitute a recommendation to buy or sell any stock, and does not take account of your objectives, or your financial situation. We aim to bring you long-term focused analysis driven by fundamental data. Note that our analysis may not factor in the latest price-sensitive company announcements or qualitative material. Simply Wall St has no position in any stocks mentioned.
