
Please use a PC Browser to access Register-Tadawul
Get It
Stock Yards Bancorp (SYBT): Assessing Valuation Following Increased Short Interest and Market Caution
Stock Yards Bancorp, Inc. SYBT | 69.02 | -0.10% |
Stock Yards Bancorp (SYBT) is drawing attention after a recent uptick in short interest, with 8% of available shares now sold short. This shift suggests investors are becoming increasingly cautious about the bank's near-term prospects compared to its peers.
While Stock Yards Bancorp’s recent jump in short interest grabs headlines, its latest share price of $68.85 reflects a year of steady total shareholder returns, climbing just 0.2% over the past twelve months. This subdued momentum suggests that the market remains cautious, balancing solid fundamentals with rising risk perception in the current climate.
If heightened caution in banks has you looking for broader opportunities, now is a smart time to widen your search and discover fast growing stocks with high insider ownership
So with rising short interest and cautious price action, is Stock Yards Bancorp currently trading below its true value? Or is the market already factoring in any upside from future growth?
Stock Yards Bancorp is trading at a price-to-earnings (P/E) ratio of 15.8 times, placing its shares at a premium compared to the broader US banks sector’s average.
The P/E ratio measures how much investors are willing to pay for $1 of the company’s earnings. For banks, this metric offers a concise look at expectations for profit growth and the underlying confidence in earnings quality.
This higher multiple relative to peers suggests investors see something attractive in Stock Yards Bancorp’s profitability, resilience, or growth prospects. However, compared to the US banks industry’s average P/E of 11.8x, the market may be assigning extra value in anticipation of stronger performance or possibly mispricing the risk. Notably, the estimated fair price-to-earnings ratio stands at 11.5x, implying current valuations could gravitate lower if future results do not justify the present confidence.
Result: Price-to-Earnings of 15.8x (OVERVALUED)
However, slowing recent returns and potential earnings risk from economic uncertainty could quickly shift investor sentiment around Stock Yards Bancorp’s premium valuation.
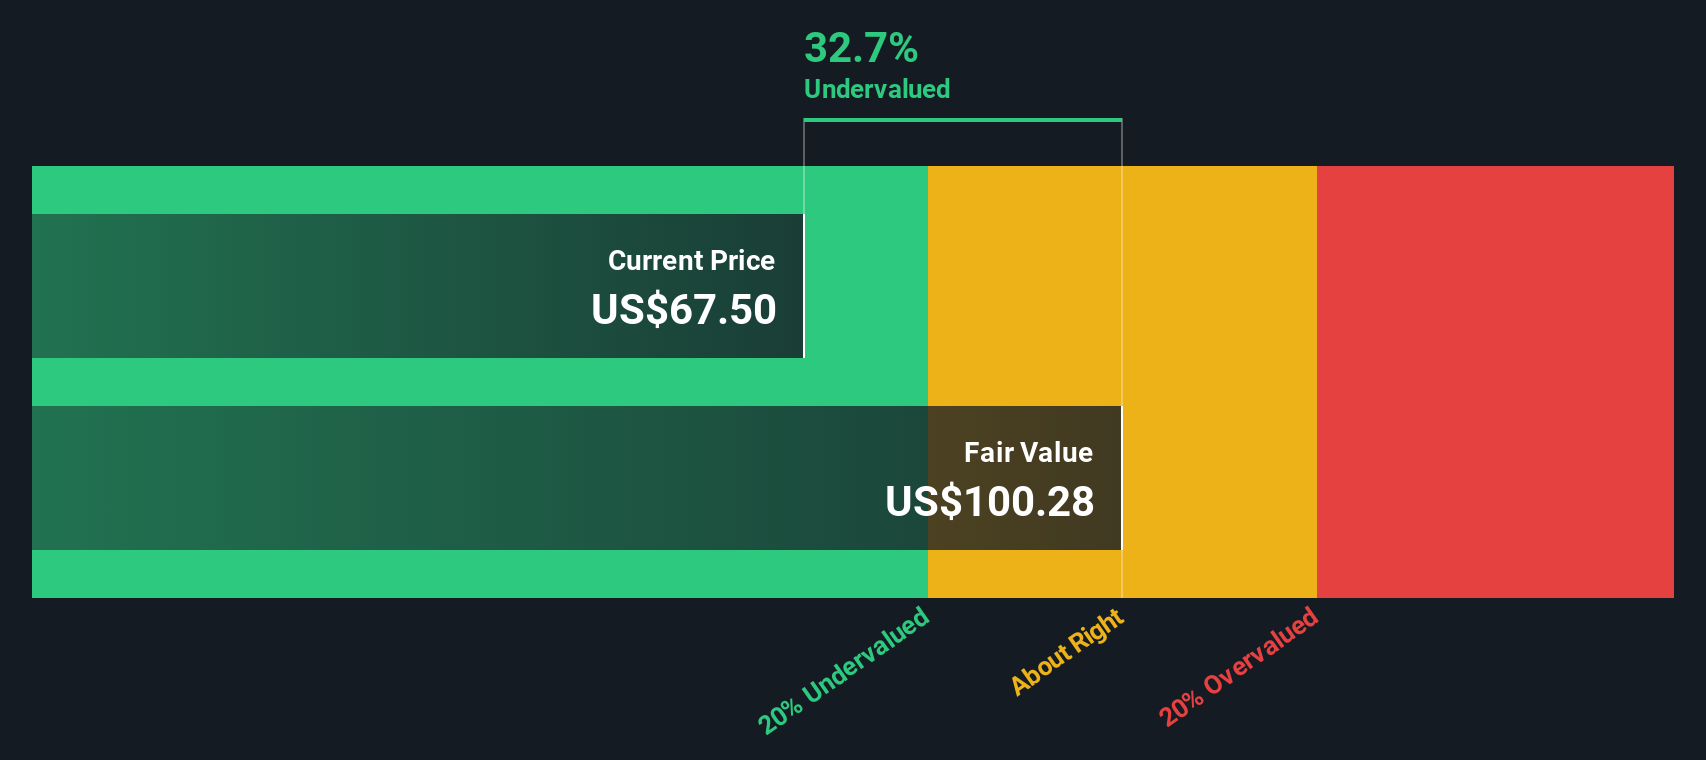
While the price-to-earnings ratio highlights signs of overvaluation, our SWS DCF model tells a different story. Based on cash flow projections, Stock Yards Bancorp appears to be trading 31.6% below its fair value. Could the market be underestimating the bank's long-term potential?
Simply Wall St performs a discounted cash flow (DCF) on every stock in the world every day (check out Stock Yards Bancorp for example). We show the entire calculation in full. You can track the result in your watchlist or portfolio and be alerted when this changes, or use our stock screener to discover undervalued stocks based on their cash flows. If you save a screener we even alert you when new companies match - so you never miss a potential opportunity.
If you have a different perspective or want to dive deeper into the numbers, you can shape your own insight in just a few minutes: Do it your way
A great starting point for your Stock Yards Bancorp research is our analysis highlighting 5 key rewards and 1 important warning sign that could impact your investment decision.
Don’t let opportunities pass you by. Maximize your portfolio’s potential with exciting stock picks from our powerful Simply Wall Street Screener.
This article by Simply Wall St is general in nature. We provide commentary based on historical data and analyst forecasts only using an unbiased methodology and our articles are not intended to be financial advice. It does not constitute a recommendation to buy or sell any stock, and does not take account of your objectives, or your financial situation. We aim to bring you long-term focused analysis driven by fundamental data. Note that our analysis may not factor in the latest price-sensitive company announcements or qualitative material. Simply Wall St has no position in any stocks mentioned.
