T-Mobile (TMUS): Evaluating Valuation Following Breakthrough 6G and AI Network Partnerships
T-Mobile US, Inc. TMUS | 210.03 | -1.83% |
T-Mobile US is drawing attention after a wave of recent announcements highlighted its expanding influence in wireless innovation. The company’s collaboration with NVIDIA on America’s first AI-native 6G wireless stack, along with new enterprise partnerships, has brought its push into the future of connectivity into focus.
While T-Mobile US continues to make headlines with industry-shaping moves, its recent momentum has not translated into short-term gains. The company has reported a 1-month share price return of -12% and a year-to-date slide of just over 4%. However, long-term shareholders are still up substantially, with a robust 46% total shareholder return over three years and 85% over five years. This reflects strong value creation despite recent volatility and insider sales by major holders like Deutsche Telekom.
If you’re interested in what else is unfolding across tech and next-gen networks, this is a great time to explore the full spectrum of opportunities with See the full list for free.
With T-Mobile's stock trading at a sizable discount to analyst price targets, investors face a familiar question: does the current valuation present a genuine buying opportunity, or is the market accurately factoring in T-Mobile’s future growth?
Most Popular Narrative: 23.5% Undervalued
T-Mobile US closed at $210.65, and the most popular narrative puts its fair value significantly higher. This sets the table for what may be a notable disconnect in expectations and current market pricing.
The launch and expansion of T-Fiber following the acquisition of Lumos, along with further expansion plans via Metronet, could lead to incremental service revenue growth and enhance long-term profitability. Innovations such as the rollout of 5G Advanced and T-Satellite, alongside enhancements in digital platforms like T-Life, signal operational improvements that could drive margin expansion and future earnings growth.
Could this valuation be riding on ambitious broadband gains, digital rollouts, and efficiency breakthroughs? Just one key profit lever could be pushing that fair value skyward. You’ll want to see how the narrative stitches those moving parts together, as there is a pivotal financial assumption that could surprise you.
Result: Fair Value of $275.19 (UNDERVALUED)
However, heightened competition and new tariffs could quickly squeeze T-Mobile’s margins. This could potentially unsettle the current outlook if conditions shift unexpectedly.
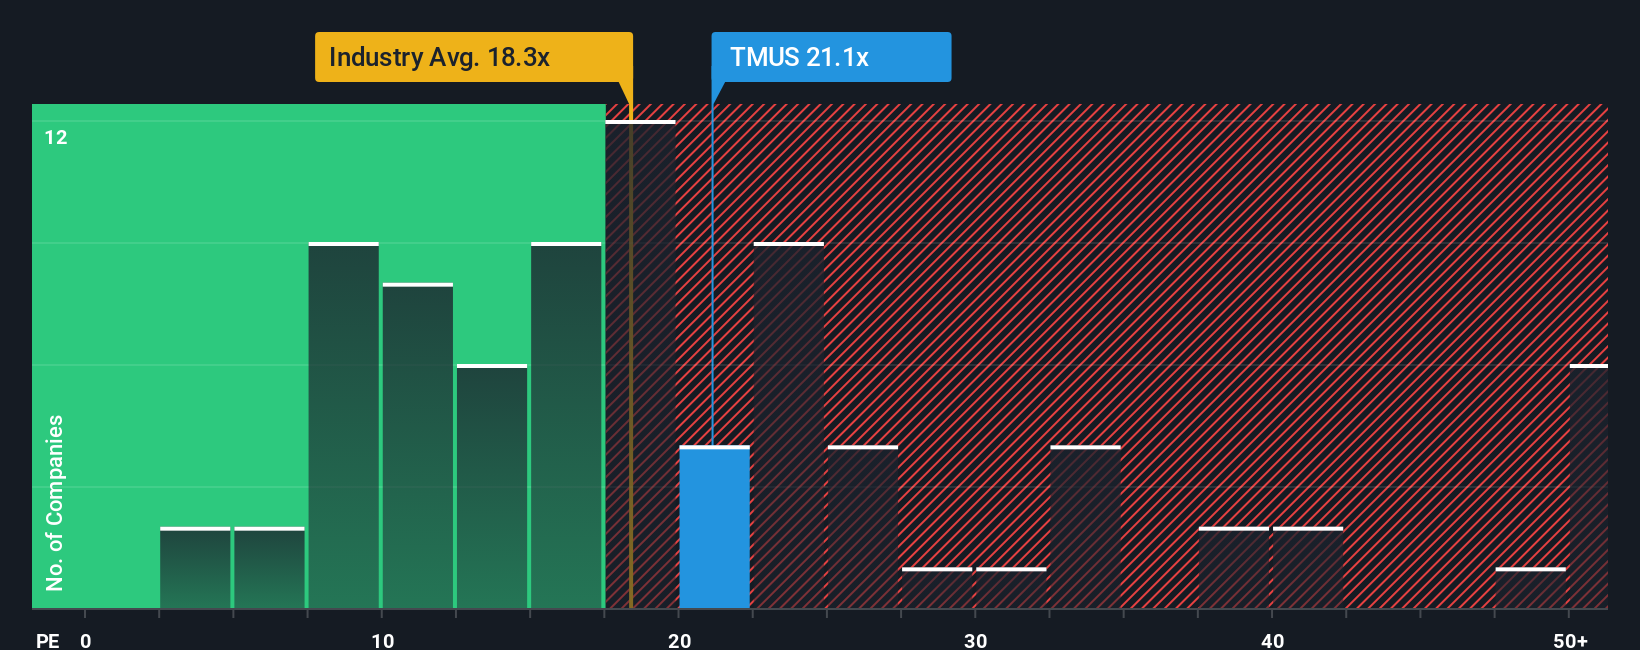
Another View: What Do the Ratios Say?
Looking at the company's price-to-earnings ratio presents a different story. T-Mobile trades at 19.8 times earnings, which is higher than both the global industry average of 18.3 and a peer average of just 7.4. The fair ratio the market could move towards is 17.3. This premium could signal excitement, or it may introduce valuation risk if the market sentiment shifts. Are buyers paying too much for future growth?
Build Your Own T-Mobile US Narrative
If you see things differently or enjoy digging into the numbers on your own, you can craft a fresh perspective in just minutes. Do it your way
A great starting point for your T-Mobile US research is our analysis highlighting 4 key rewards and 1 important warning sign that could impact your investment decision.
Looking for More Investment Ideas?
Don’t limit your strategy to just one opportunity. Explore these effective ways to spot potential winners and stay ahead of market trends using these hand-picked stock ideas from Simply Wall Street:
- Boost your income by targeting companies offering impressive yields with the help of these 24 dividend stocks with yields > 3%.
- Spot tomorrow’s tech leaders by checking out these 26 AI penny stocks for businesses making waves in artificial intelligence.
- Seize rare bargains by tracking undervalued opportunities quickly through these 831 undervalued stocks based on cash flows.
This article by Simply Wall St is general in nature. We provide commentary based on historical data and analyst forecasts only using an unbiased methodology and our articles are not intended to be financial advice. It does not constitute a recommendation to buy or sell any stock, and does not take account of your objectives, or your financial situation. We aim to bring you long-term focused analysis driven by fundamental data. Note that our analysis may not factor in the latest price-sensitive company announcements or qualitative material. Simply Wall St has no position in any stocks mentioned.