
Please use a PC Browser to access Register-Tadawul
Get It
The Bull Case For ATI (ATI) Could Change Following Strong Q4 Beat And Upbeat 2026 Outlook
ATI Inc. ATI | 143.93 | +2.95% |
The latest GPUs need a type of rare earth metal called Neodymium and there are only 33 companies in the world exploring or producing it. Find the list for free.
For ATI, the big-picture belief is that its specialty metals portfolio will keep benefiting from structurally high demand in aerospace, defense and related energy markets, and that management can steadily convert that into higher-quality earnings and cash flow. The latest results broadly support that view: record full-year revenue of US$4,587.4 million, stronger full-year net income of US$404.3 million, expanding margins and 2026 guidance that points to higher earnings and US$1.0 billion in adjusted EBITDA. Near term, the key catalysts now look tied to execution on aerospace engine and missile contracts, scaling proprietary nickel alloys, and translating customer-funded capacity additions into cash generation, rather than top line surprises. The flip side is that a rich valuation, high debt and recent insider selling leave less room for slip-ups if those growth projects hit bottlenecks.
However, one risk in particular could matter more than many investors might assume. ATI's shares are on the way up, but they could be overextended by 11%. Uncover the fair value now.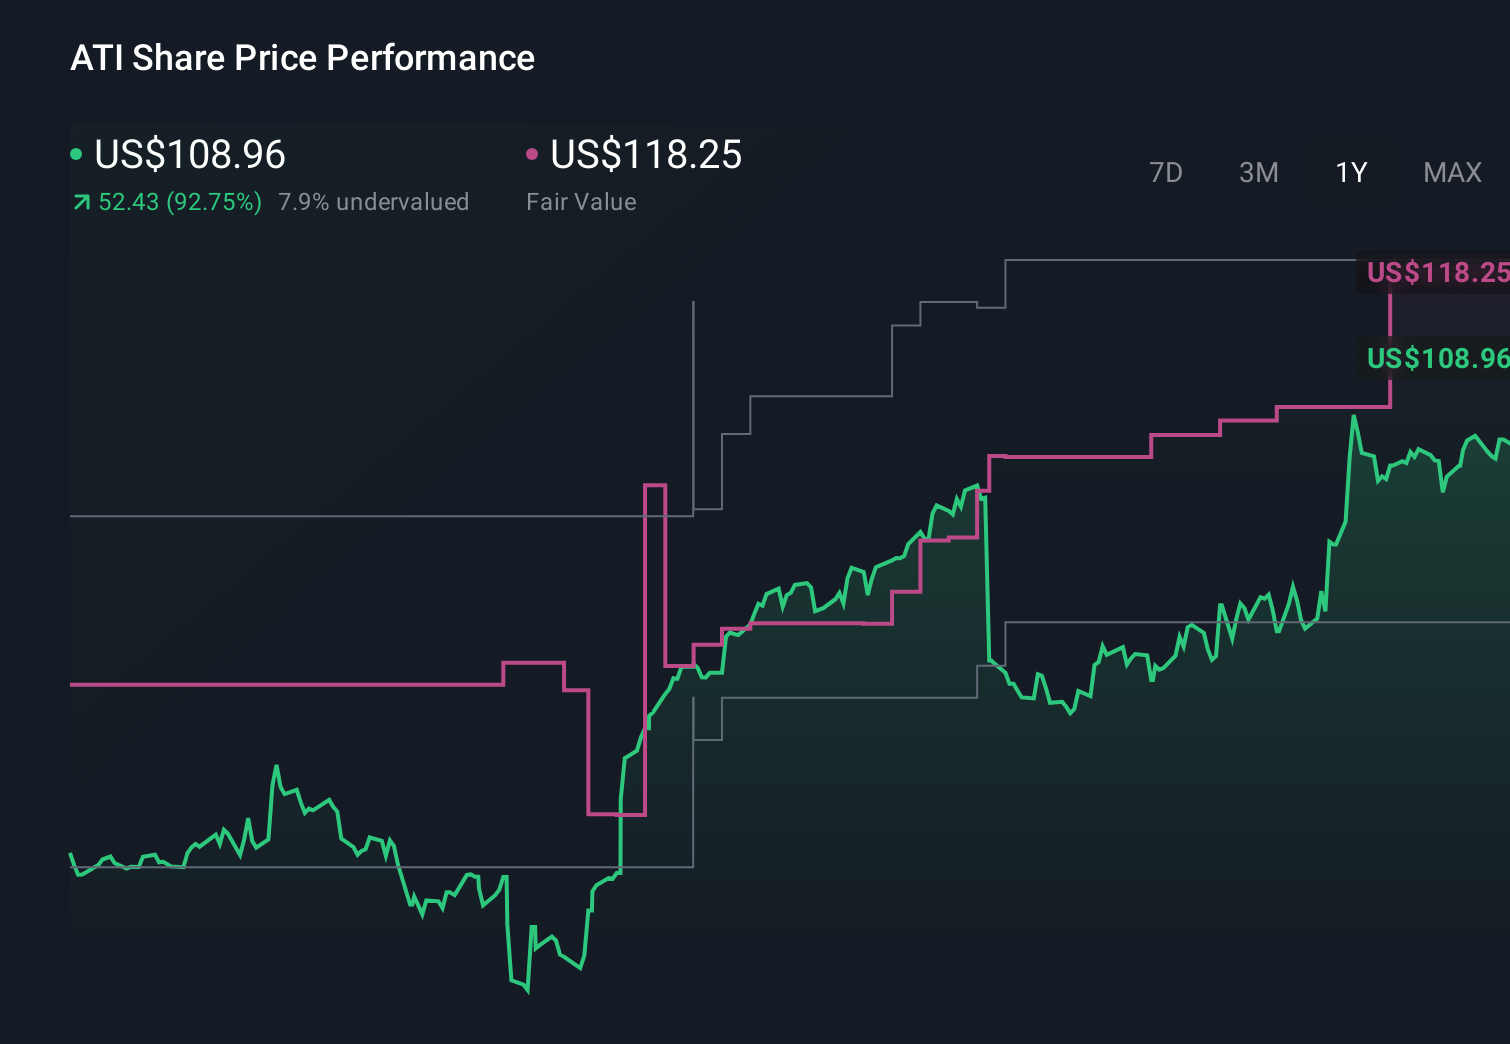
Explore 5 other fair value estimates on ATI - why the stock might be worth as much as 29% more than the current price!
Disagree with this assessment? Create your own narrative in under 3 minutes - extraordinary investment returns rarely come from following the herd.
Right now could be the best entry point. These picks are fresh from our daily scans. Don't delay:
This article by Simply Wall St is general in nature. We provide commentary based on historical data and analyst forecasts only using an unbiased methodology and our articles are not intended to be financial advice. It does not constitute a recommendation to buy or sell any stock, and does not take account of your objectives, or your financial situation. We aim to bring you long-term focused analysis driven by fundamental data. Note that our analysis may not factor in the latest price-sensitive company announcements or qualitative material. Simply Wall St has no position in any stocks mentioned.
