
Please use a PC Browser to access Register-Tadawul
Get It
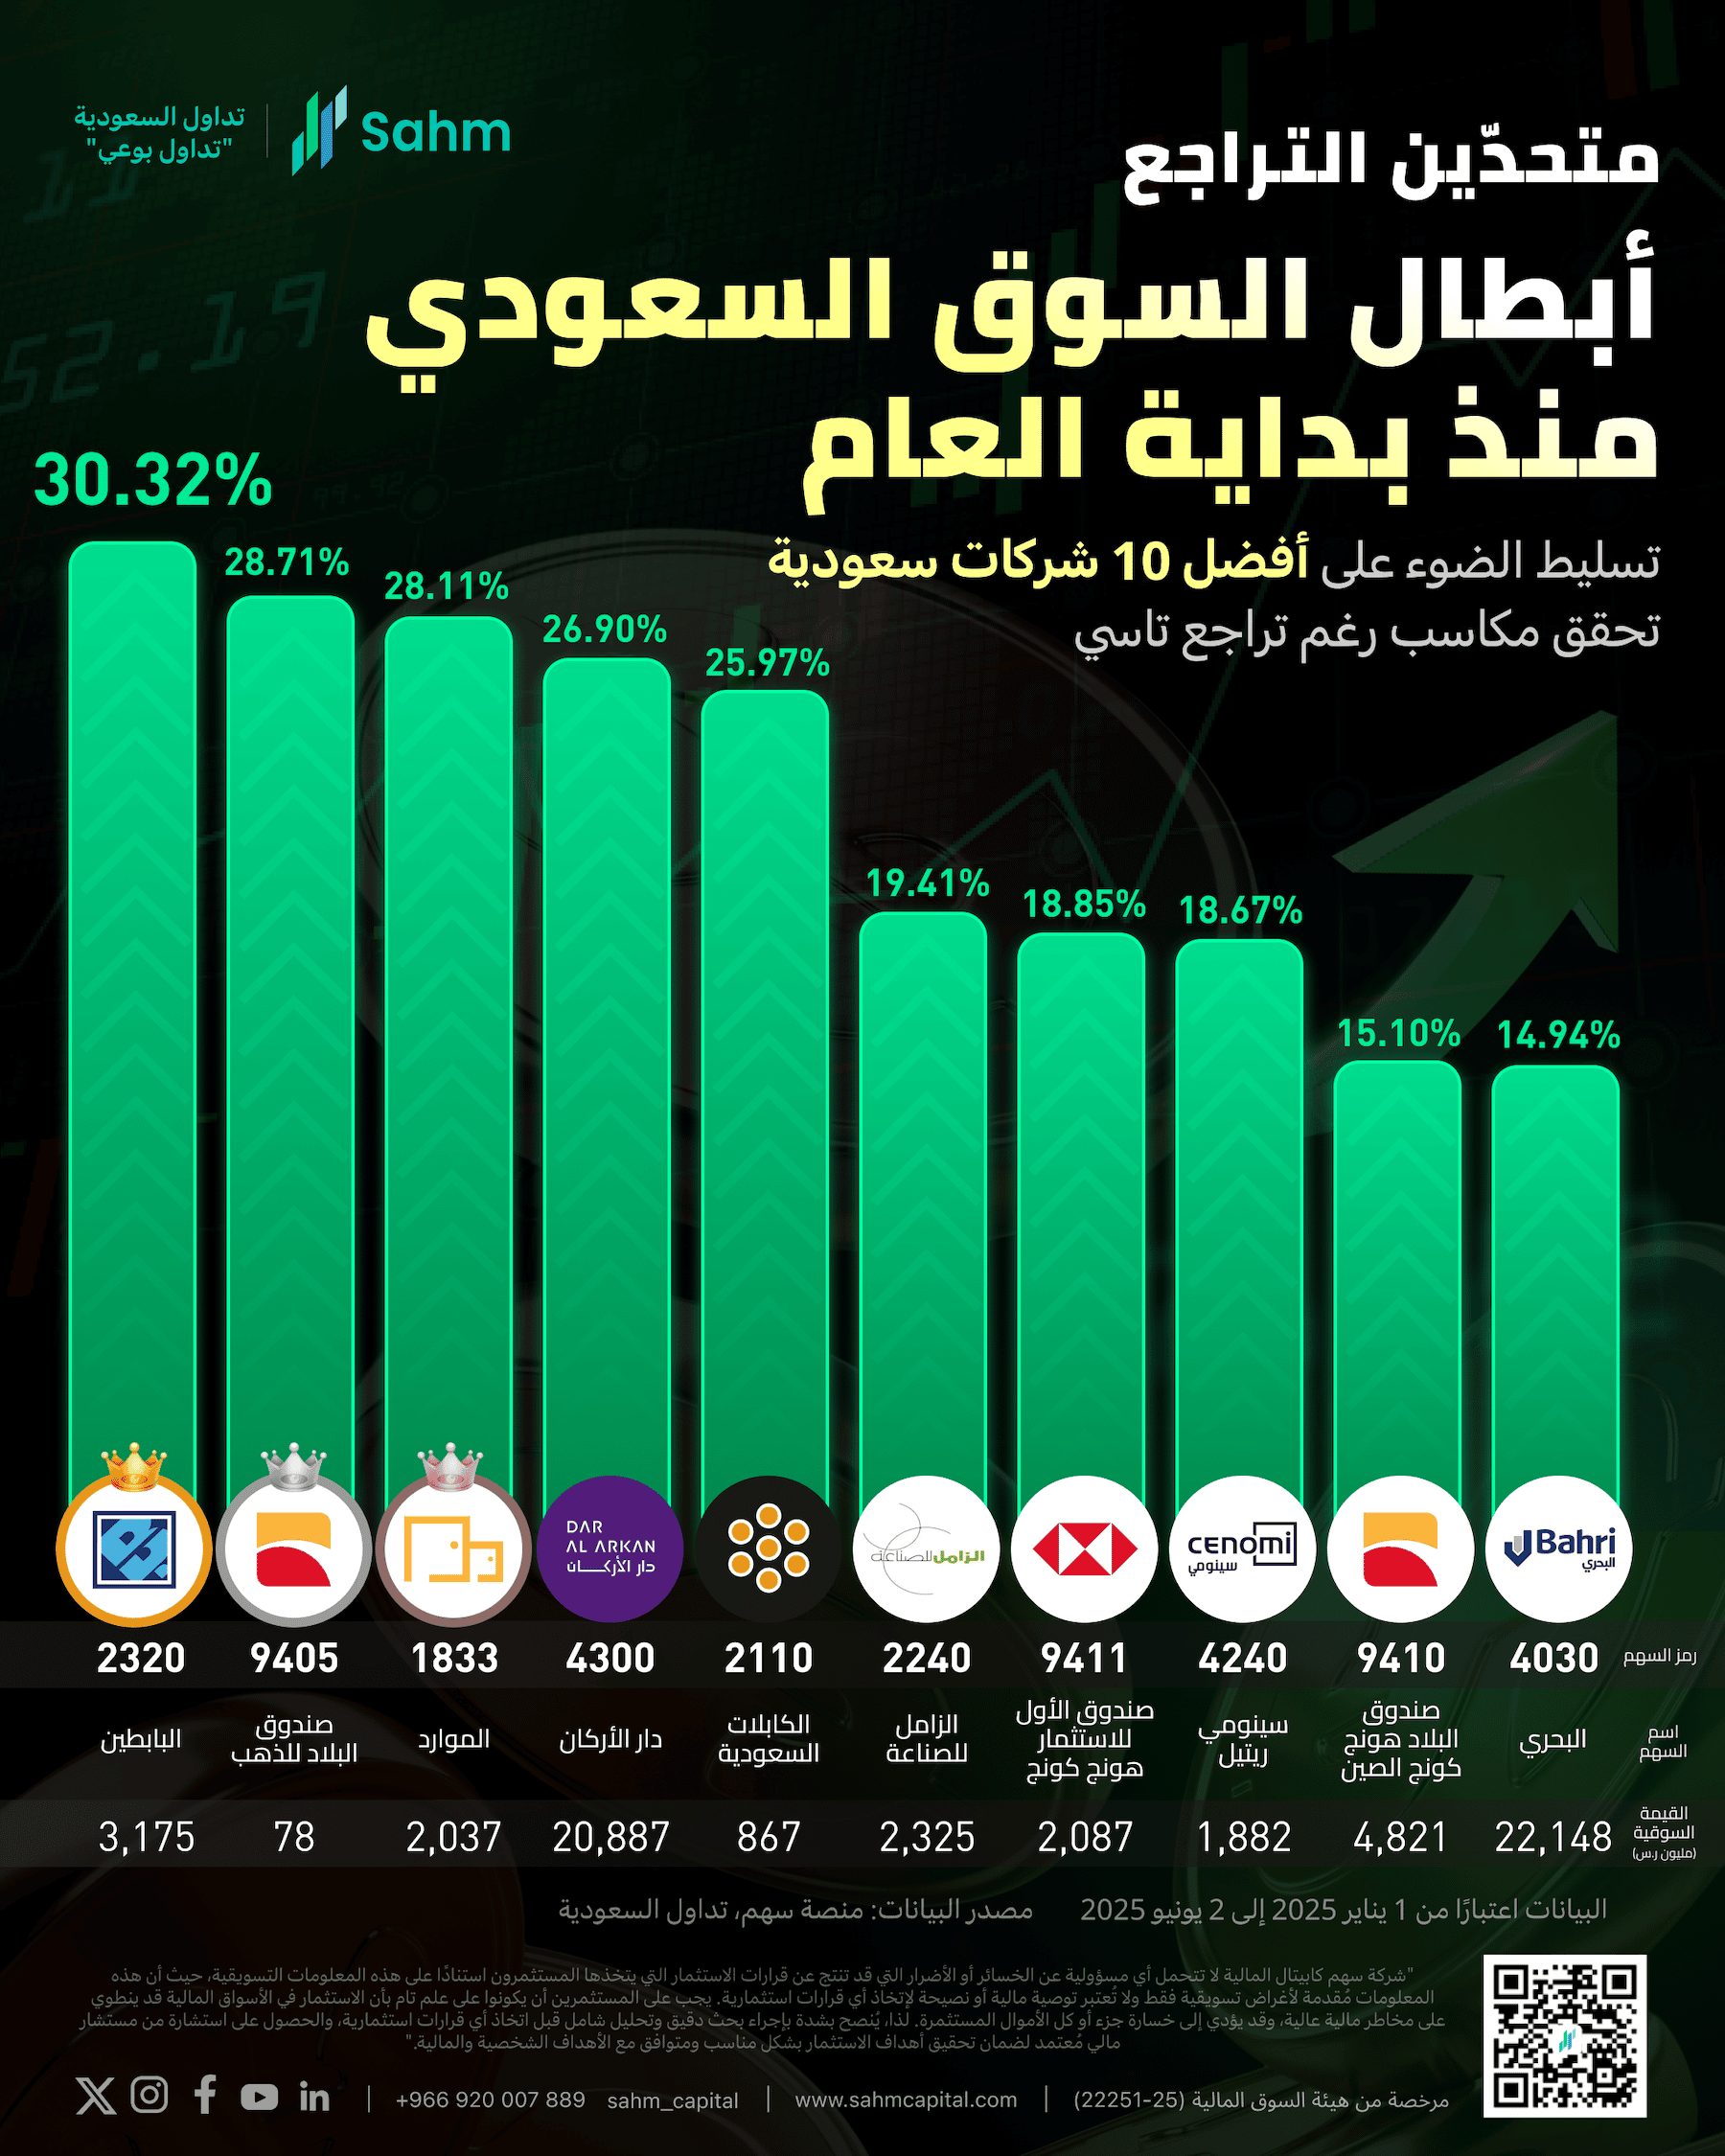
Top 10 KSA Stocks Thriving YTD Despite Market Turmoil – Who Made It?
ALBABTAIN 2320.SA | 67.75 | -1.81% |
ALBILAD GOLD ETF 9405.SA | 22.19 | -0.98% |
ALMAWARID 1833.SA | 130.70 | -2.24% |
DAR ALARKAN 4300.SA | 15.80 | +3.47% |
SAUDI CABLE 2110.SA | 127.70 | -1.39% |
The year 2025 has certainly kept investors on their toes.
A global market correction, initiated by a downturn in U.S. stocks from late February and intensified by an April plunge—largely attributed to the introduction of sweeping U.S. tariffs under President Donald Trump's "Liberation Day" policy—has created a volatile environment.
These tariffs, which imposed broad levies on imports from key trading partners such as China, Canada, and Mexico, triggered a global stock market crash, with the S&P 500 losing over 10% in early April. The Organization for Economic Co-operation and Development (OECD) subsequently downgraded global growth forecasts, citing the disruptive impact of these trade measures on supply chains and investor confidence.
Saudi Arabia's Tadawul All Shares Index(TASI.SA) mirrored this global trend, experiencing a significant drop in April. While there's been some rebound, the index continues to navigate choppy waters, with market watchers speculating on a potential second bottom.
But even in the midst of widespread caution, there are always stories of resilience. Some companies, through unique strengths, strategic positioning, or sector-specific tailwinds, manage to not just survive but thrive. This is precisely what we're seeing in the Kingdom.
Our accompanying infographic, casts a spotlight on the Top 10 KSA companies that have delivered positive year-to-date returns (from January 1, 2025 to June 2, 2025), even as the broader TASI searches for solid footing. These aren't just numbers; they're indicators of underlying strength and perhaps a different narrative playing out for specific segments of the Saudi economy.
Looking at the list, it’s fascinating to see the diversity. From Al-Babtain Power and Telecommunication Co.(2320.SA) in Capital Goods leading the charge with an impressive 30.32% YTD gain, to the consistent performance of funds like the Albilad Gold ETF(9405.SA), which has climbed 28.71% year-to-date. This surge aligns with a broader investor shift toward perceived safe-haven assets amid escalating trade tensions and market volatility. Gold prices reached record highs during this period, reflecting heightened demand as investors sought to mitigate risks associated with the global economic downturn.
It's noteworthy that Capital Goods appears twice in the top five, with Saudi Cable Co.(2110.SA) also showing a robust 25.97% increase. The presence of ETFs focusing on international markets, such as the SAB Invest Hang Seng Hong Kong ETF(9411.SA) and Albilad CSOP MSCI Hong Kong China Equity ETF(9410.SA), suggests that diversified investment vehicles are also finding favor. Meanwhile, companies like Al Mawarid Manpower Co.(1833.SA) in Commercial & Professional Services and Dar Alarkan Real Estate Development Co.(4300.SA) in Real Estate Management & Development further illustrate that positive performance isn't confined to a single industry.
This curated list of YTD outperformers offers a valuable snapshot for those following the Saudi market. It demonstrates that even when headline indices paint a challenging picture, individual company stories can vary significantly. These companies have managed to navigate the prevailing headwinds, showcasing growth in a period where it's a scarce commodity.
While past performance is never a guarantee of future results, and this overview is purely for informational purposes, understanding these pockets of strength provides a more nuanced view of the market's dynamics. It’s a reminder of the diverse opportunities and inherent resilience within the Saudi economic landscape.
Dive deeper into the data with our infographic, "DEFYING THE DOWNTURN: Saudi Arabia's YTD Champions," to see the full list and their remarkable performance!
This article and the accompanying infographic are for informational purposes only and should not be construed as financial or investment advice. Market conditions are dynamic, and past performance is not indicative of future results. Readers should conduct their own thorough research and consult with a qualified financial advisor before making any investment decisions.
