Trading Insights | January Seasonality: A Historically Prosperous Month for TASI, Meeting New Era with TASI 50 Index Launch
Tadawul All Shares Index TASI.SA | 0.00 | |
SAUDI ARAMCO 2222.SA | 0.00 | |
ALRAJHI 1120.SA | 0.00 | |
SNB 1180.SA | 0.00 | |
SABIC 2010.SA | 0.00 |
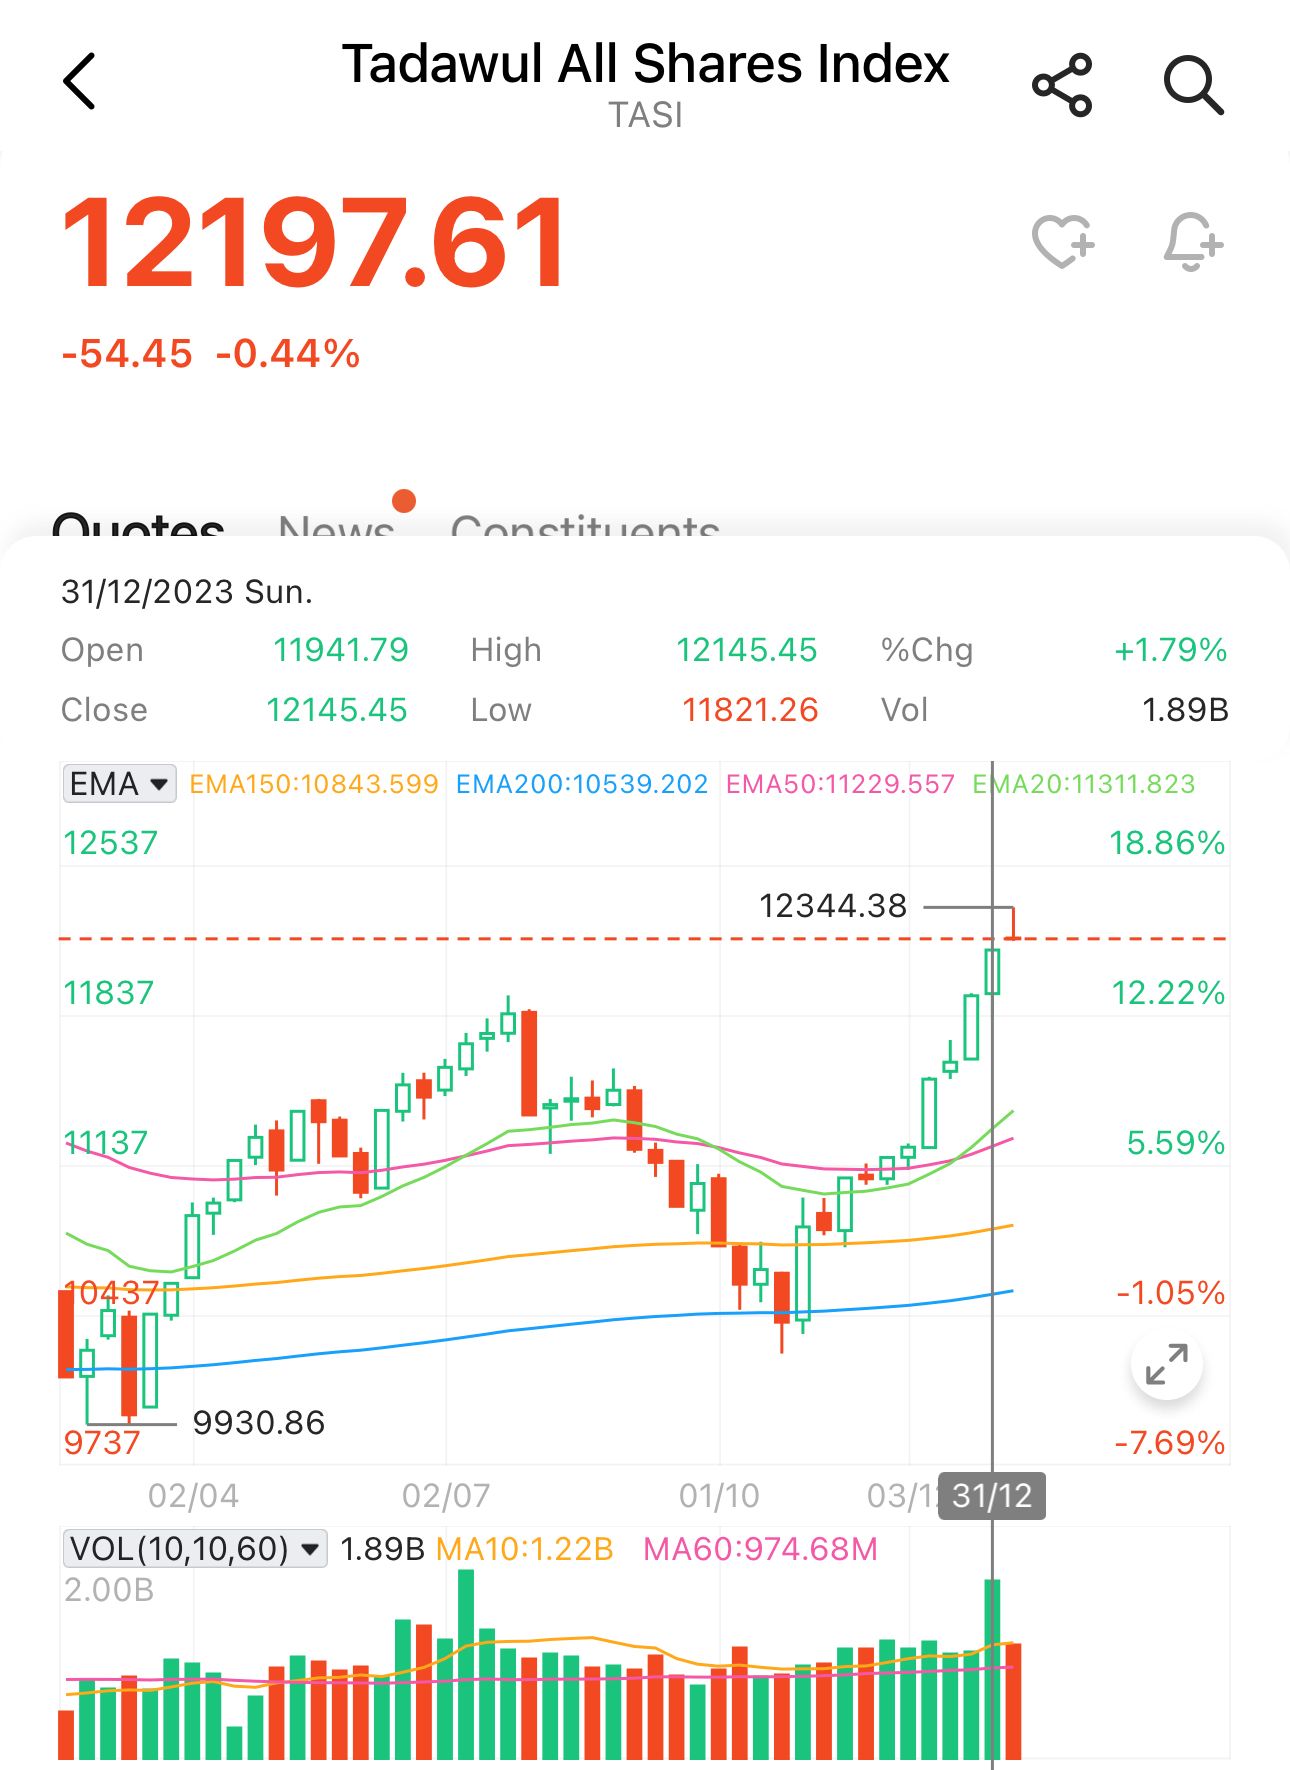
In the first trading week of 2024, the Tadawul All Shares Index(TASI.SA) continued its upward trend from December, climbing 1.79%. This was accompanied by a significant increase in trading volume, reaching 1.89 billion, which is 55% higher than its 10-week moving average (10MA). The last time such high volumes were observed was in July 2023.
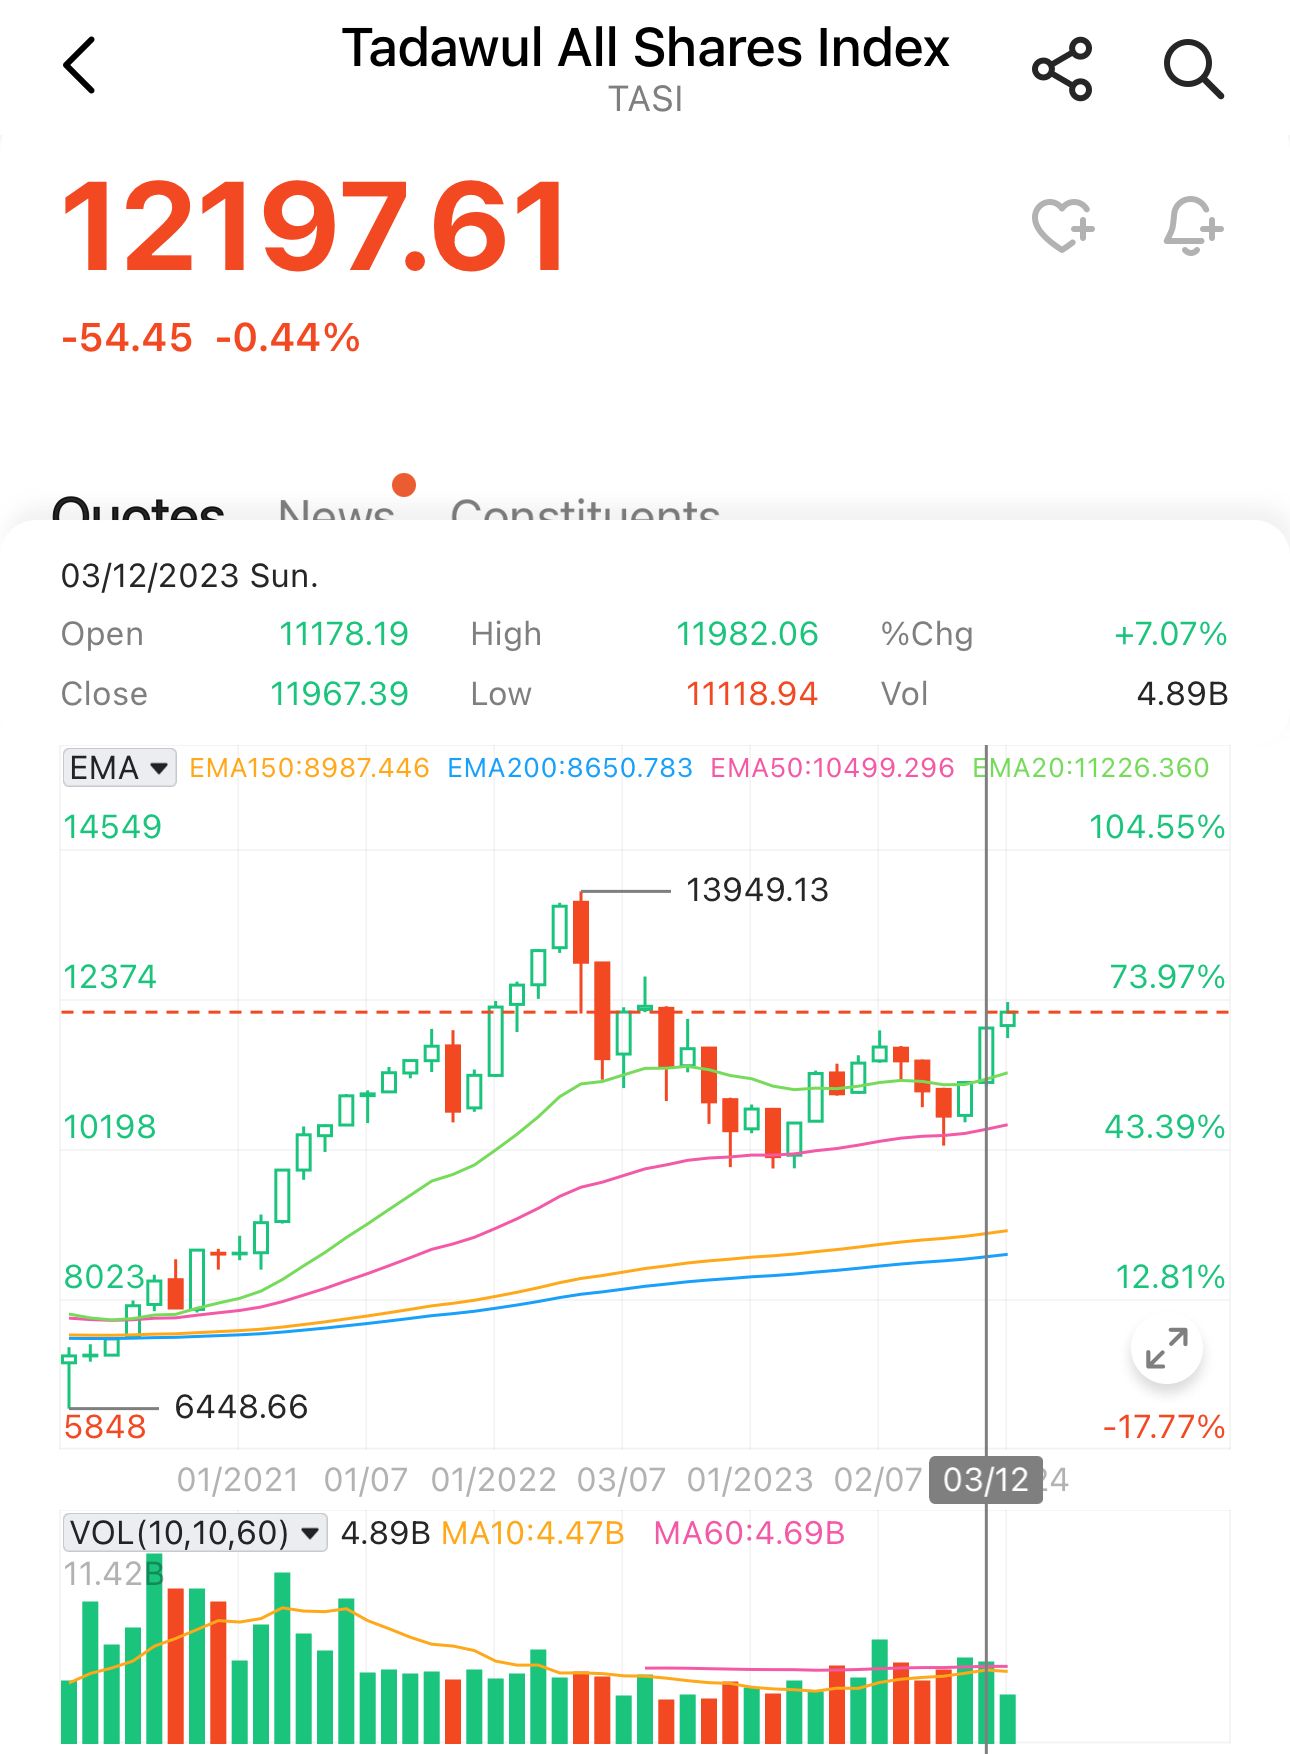
As discussed back in our late November 2023 analysis, TASI Index Eyes Recovery with 4% November Gains, December Seasonality Signals Potential Follow-Through, Factset's seasonality data showed the Tadawul All Shares Index(TASI.SA)'s 10-year average December gain at 0.9%. Interestingly, in December 2023, the TASI outperformed expectations, closing up 7.1% - its highest monthly closing since August 2022. This rise also confirmed the continuous effectiveness of the 50EMA (Exponential Moving Average) as a technical support on the monthly charts.
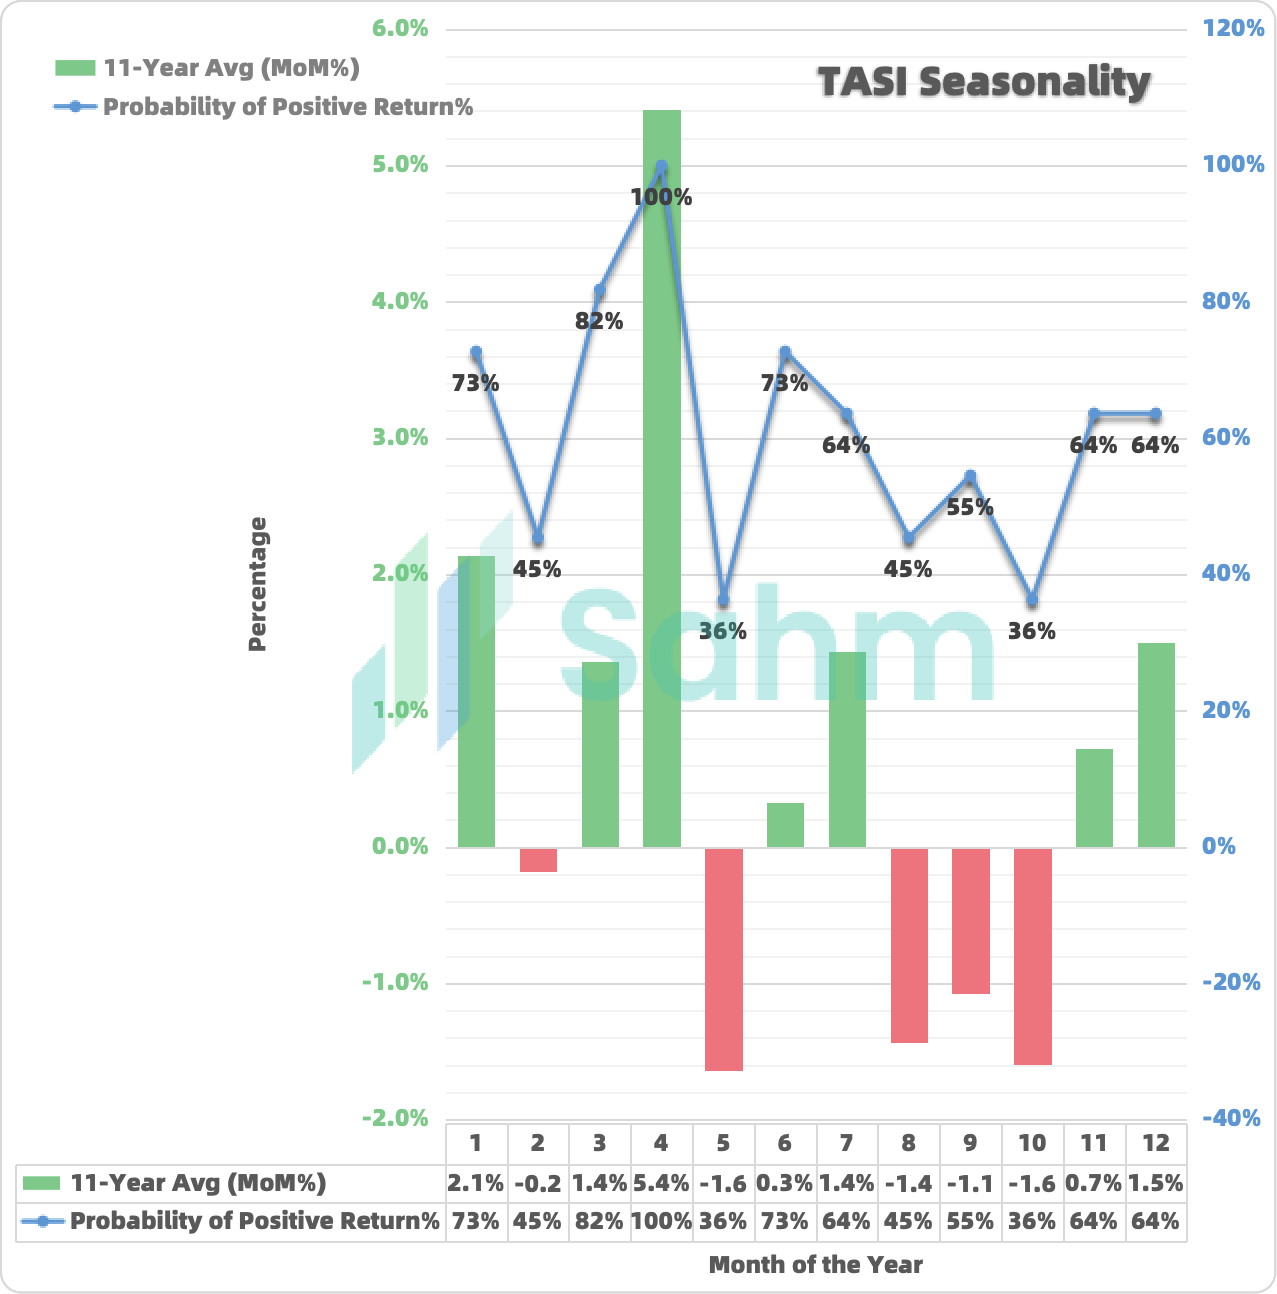
Back to the current market, the latest seasonality data indicates that January is historically the second-best performing month for Tadawul All Shares Index(TASI.SA), following April. The average month-on-month return for January is 2.1%, with a 73% probability of yielding positive returns. This means that in 8 out of the past 11 years, January has ended on a positive note. More detailed data is presented in the chart below.
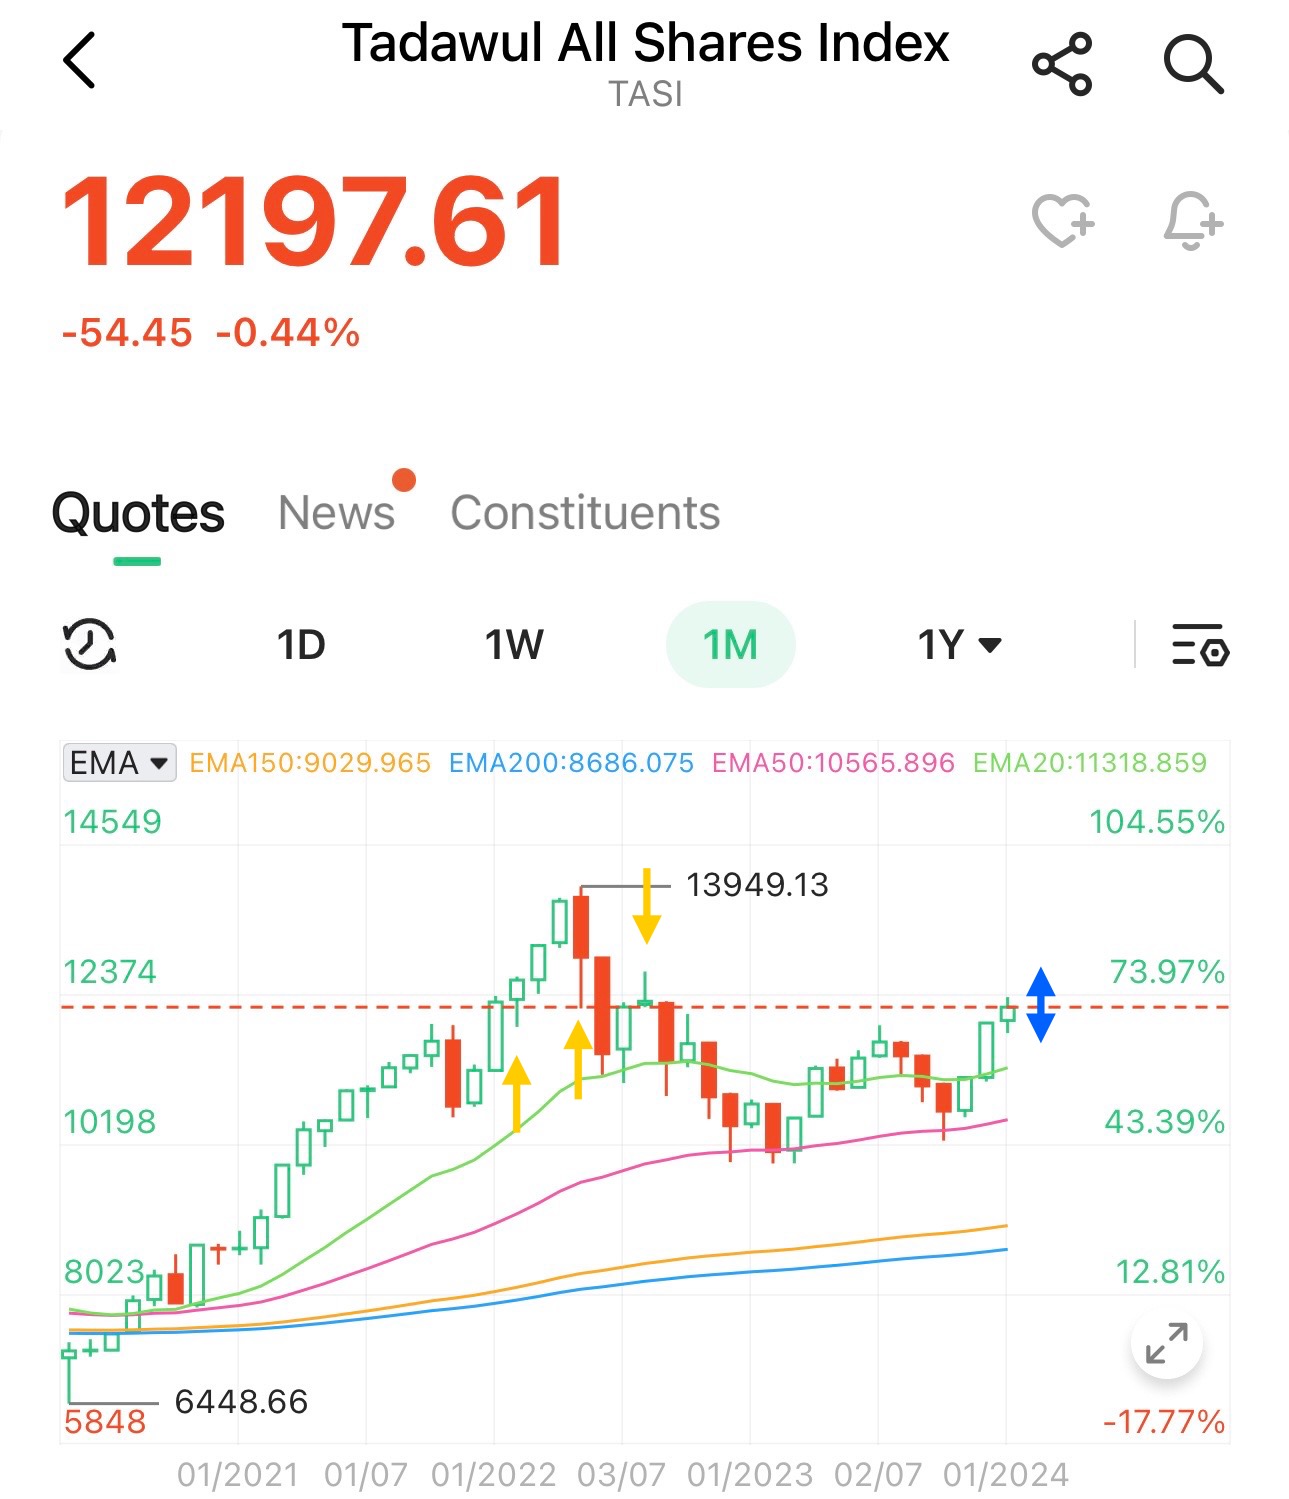
However, it's crucial to note that past performance does not guarantee future results. Especially considering Tadawul All Shares Index(TASI.SA)'s robust 7.1% rise in December, and as of this week starting January 7th, the index is nearing its August 2022 closing levels. These levels also coincide with key levels from January and May 2022, potential pullback risks should be considered by investors.
Another noteworthy development from the Saudi Exchange Company on January 7th, 2024, was the announcement of the launch of the TASI50 Index.
The Saudi TASI 50 Index launch could offer benefits for included stocks, such as enhanced visibility, improved liquidity, benchmarking capabilities, and attraction of passive investments. This recognition symbolizes financial robustness, potentially boosting investor confidence in these companies. However, it's crucial for investors to remember that market conditions vary and inclusion in the index doesn't assure sustained positive performance. Investment decisions should rely on thorough market analysis.
Regarding the constituents of the TASI 50, the Saudi Exchange has not disclosed specific details. However, based on the index's eligibility criteria and publicly available Index Calculation Methodology, the top 10 companies by market value in the index are likely as follows:
Saudi Arabian Oil Co.(2222.SA), Al Rajhi Bank(1120.SA), The Saudi National Bank(1180.SA), Saudi Basic Industries Corp.(2010.SA), Saudi Telecom Co.(7010.SA), ACWA POWER Co.(2082.SA), Saudi Arabian Mining Co.(1211.SA), Dr. Sulaiman Al Habib Medical Services Group(4013.SA), Riyad Bank(1010.SA), Saudi Electricity Co.(5110.SA).
Meanwhile, an exploration of the average seasonal performance in January and February over the past ten years, along with the latest target prices set by market analysts for these ten companies, offers an additional layer of insight for assessing their potential.
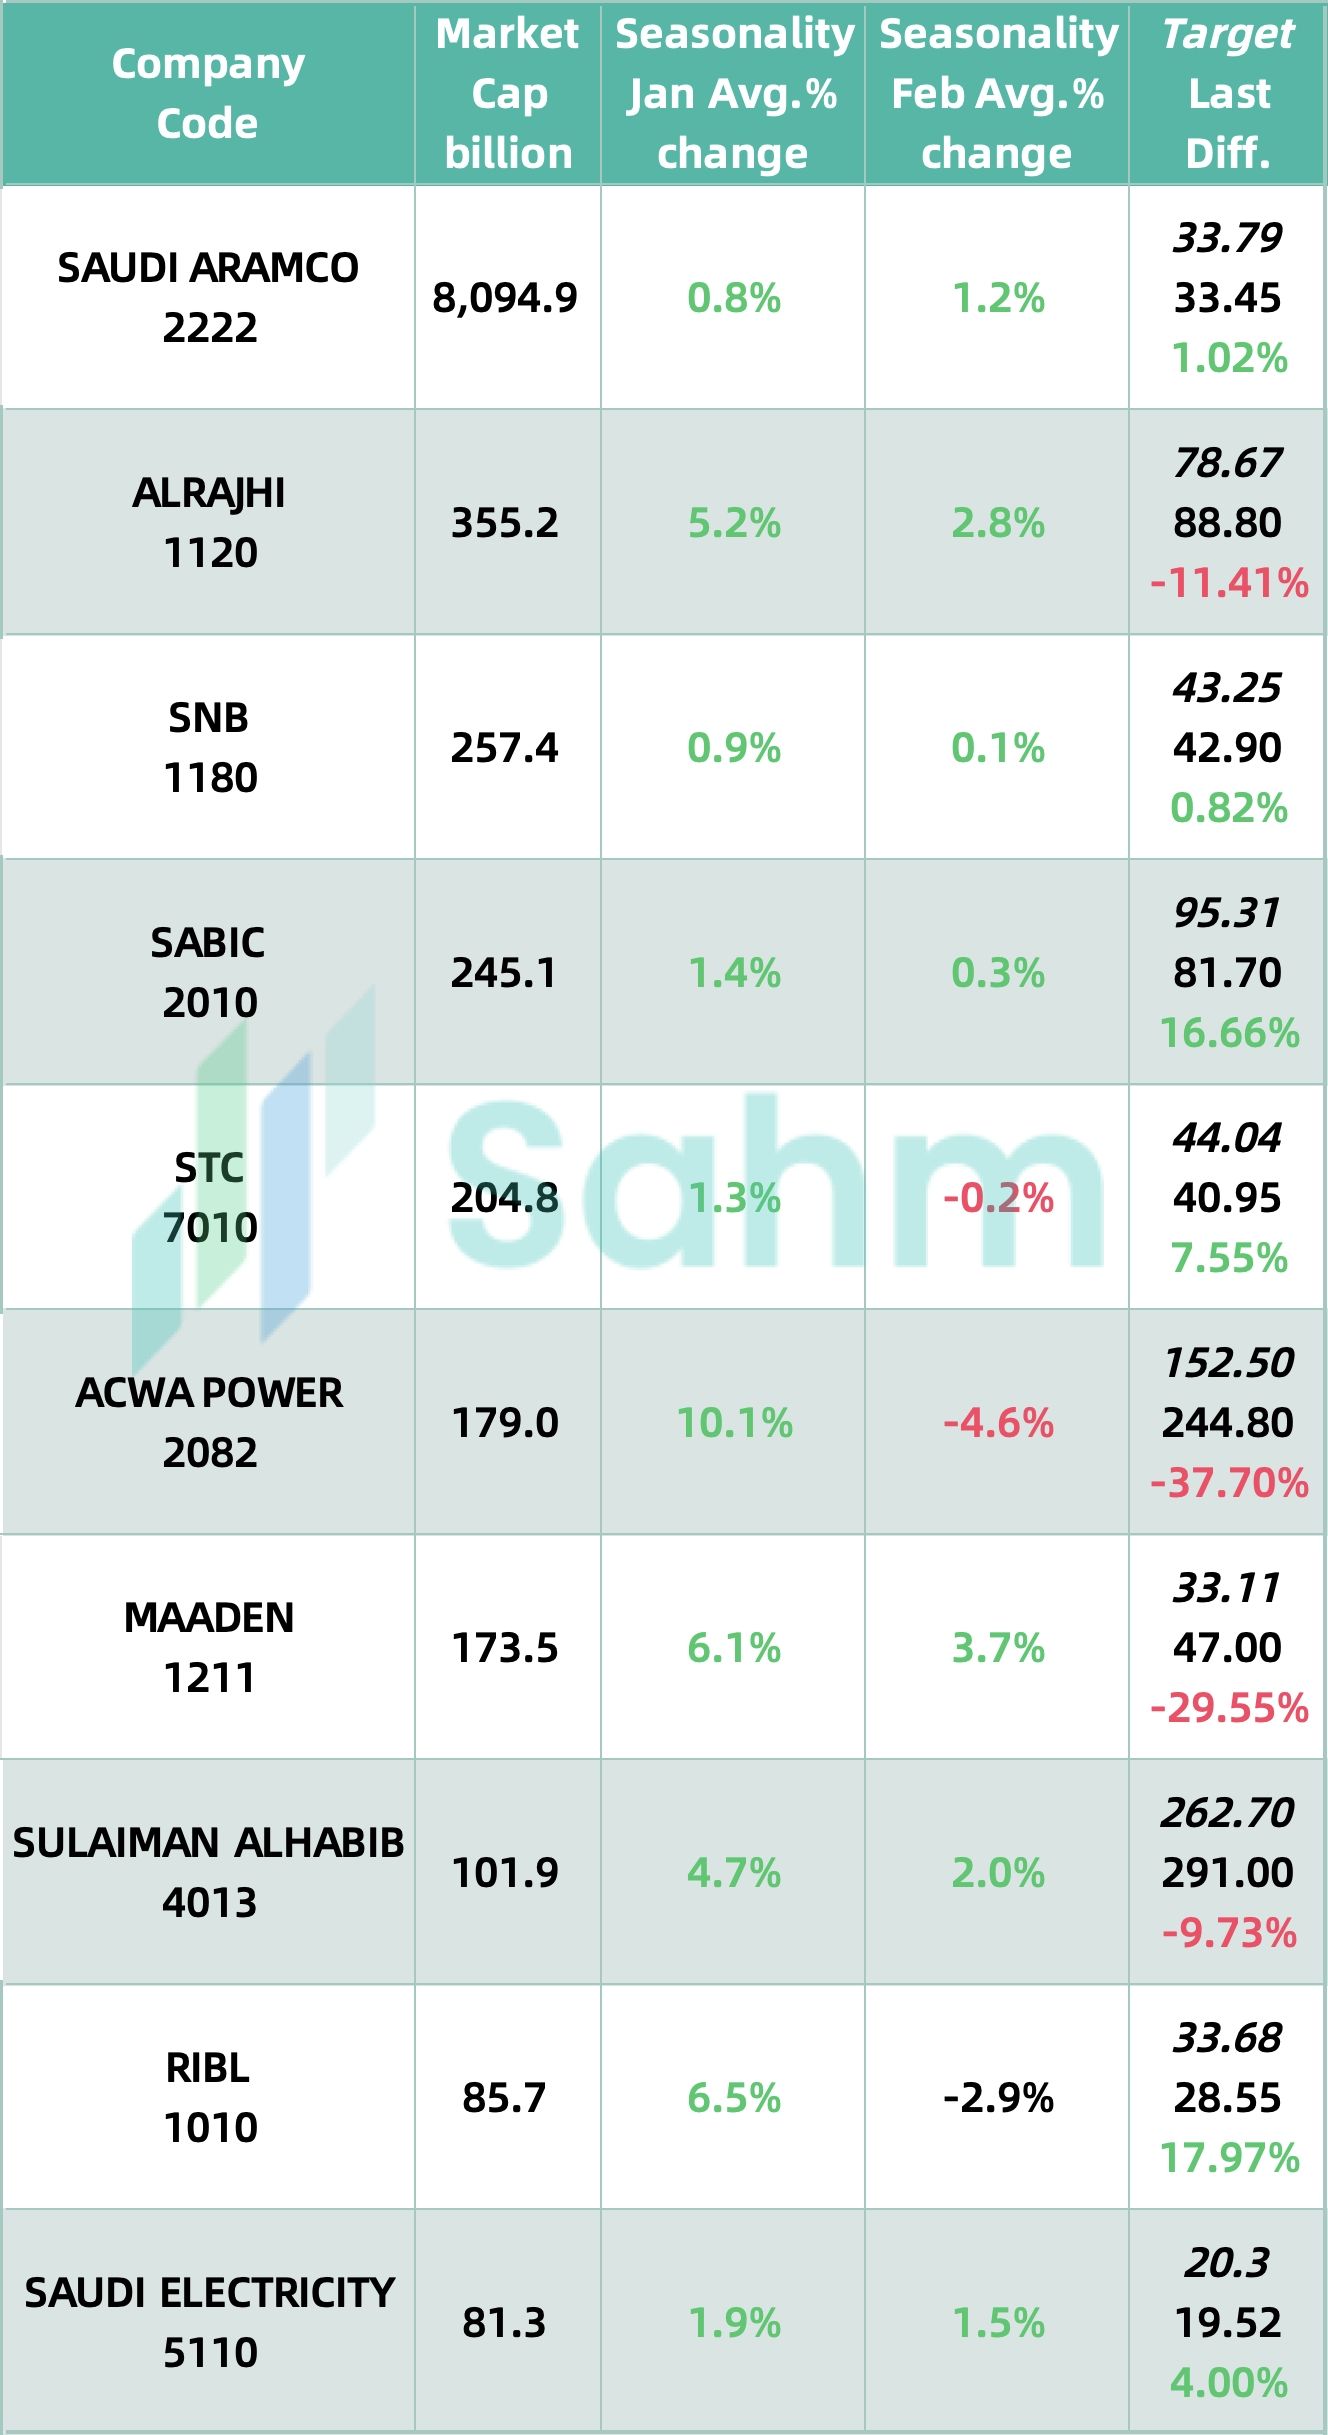
Note: Market capitalization and closing prices in the above table are as of January 8, 2024. Seasonality data represents the average for the corresponding month over the past ten years. For companies with less than ten years of trading history, the data represents the average for the corresponding month over their full trading historical data. Target prices sourced from Simply Wall St and Marketscreener. All values are in SAR.