
Please use a PC Browser to access Register-Tadawul
Get It
Turtle Beach Full Year 2024 Earnings: Misses Expectations
Turtle Beach Corp Ordinary Shares TBCH | 14.95 | -0.33% |
All figures shown in the chart above are for the trailing 12 month (TTM) period
Revenue missed analyst estimates by 1.3%. Earnings per share (EPS) also missed analyst estimates by 16%.
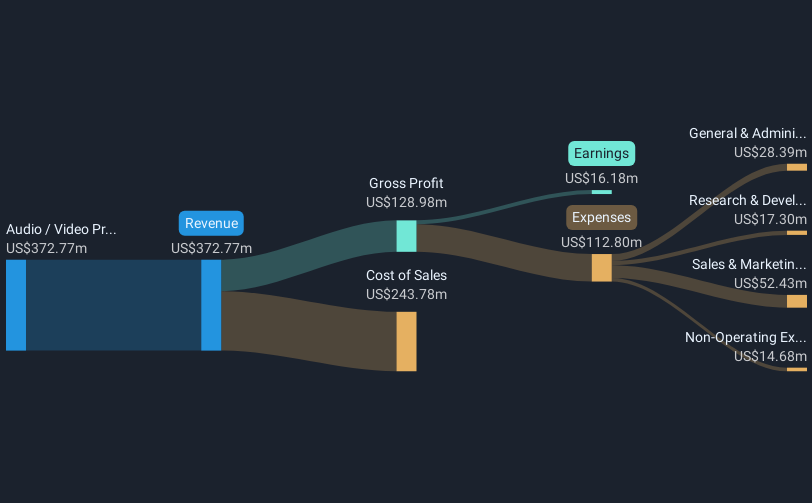
In the last 12 months, the only revenue segment was Audio / Video Products contributing US$372.8m. Notably, cost of sales worth US$243.8m amounted to 65% of total revenue thereby underscoring the impact on earnings. The largest operating expense was Sales & Marketing costs, amounting to US$52.4m (46% of total expenses). Explore how TBCH's revenue and expenses shape its earnings.
Looking ahead, revenue is forecast to grow 7.7% p.a. on average during the next 3 years, compared to a 6.6% growth forecast for the Tech industry in the US.
The company's shares are down 12% from a week ago.
Be aware that Turtle Beach is showing 2 warning signs in our investment analysis and 1 of those is significant...
This article by Simply Wall St is general in nature. We provide commentary based on historical data and analyst forecasts only using an unbiased methodology and our articles are not intended to be financial advice. It does not constitute a recommendation to buy or sell any stock, and does not take account of your objectives, or your financial situation. We aim to bring you long-term focused analysis driven by fundamental data. Note that our analysis may not factor in the latest price-sensitive company announcements or qualitative material. Simply Wall St has no position in any stocks mentioned.
