
Please use a PC Browser to access Register-Tadawul
Get It
Ultra Clean Holdings (UCTT) Valuation Check After Earnings Beat And AI Supply Chain And Needham Conference Boost
Ultra Clean Holdings, Inc. UCTT | 59.15 | +2.91% |
Ultra Clean Holdings (UCTT) has been in focus after quarterly results beat analyst expectations and highlighted firm gross margins, while its role in the AI chip supply chain and a high profile Needham conference appearance drew fresh investor attention.
The share price has moved sharply, with a 30 day share price return of 81.76% and a year to date share price return of 60.14%, while the 1 year total shareholder return of 13.22% and 5 year total shareholder return of 0.90% point to momentum that is more recent than long running. This has been helped by the 52 week high and interest around the Needham conference appearance and AI chip supply chain exposure.
If Ultra Clean’s recent surge has you looking at the wider semiconductor story, this is a good moment to scan other high growth tech and AI stocks that are catching market attention.
After an 82% 30 day jump and a share price now above Needham’s US$35 target, the key question is whether Ultra Clean is still trading at an attractive entry point or if the market is already pricing in future growth.
Ultra Clean Holdings last closed at US$43.75, while the most followed narrative anchors fair value at US$35.00, setting up a clear valuation gap for investors to weigh.
Ongoing organizational flattening, cost reduction initiatives, and factory/site consolidation are producing tangible decreases in OpEx, with further improvements expected by Q4. These changes provide sustainable margin enhancement as industry volumes recover. Progress in vertical integration, particularly the Fluid Solutions business unit, along with deployment of company wide SAP systems, is set to improve operational efficiency and streamline customer engagement, supporting a higher margin mix and improved earnings beginning in early 2026.
Curious what kind of revenue path and profit margin shift could justify that fair value and a higher future P/E than the sector? The full narrative lays out a detailed earnings bridge, a specific profit turnaround timeline, and the growth assumptions that connect today’s losses to those forward-looking numbers.
Result: Fair Value of $35 (OVERVALUED)
However, there are still clear pressure points, including reliance on a handful of major customers and the risk that wafer fab equipment spending remains softer for a longer period.
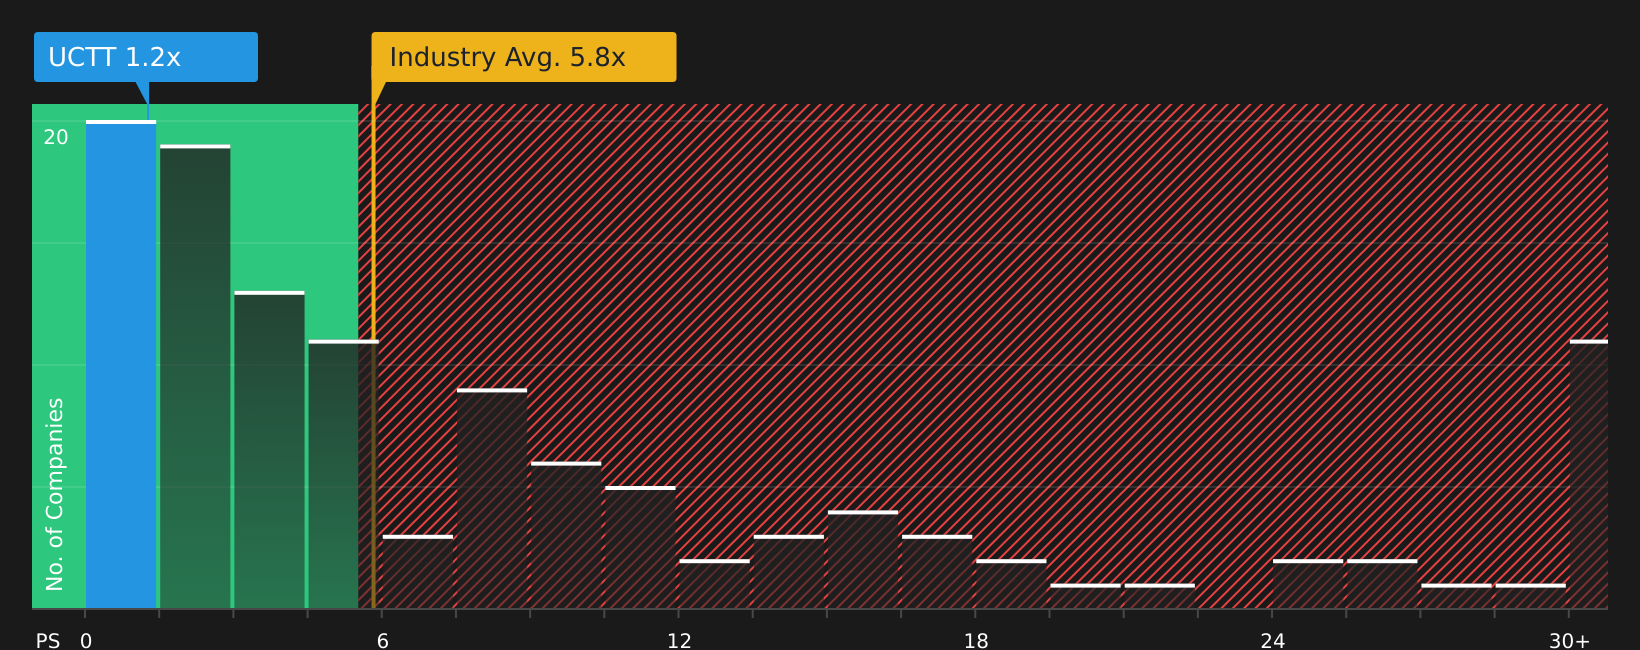
While the narrative fair value of US$35 suggests Ultra Clean Holdings looks overvalued at US$43.75, the current P/S of 0.9x tells a different story. That is well below peers at 6.3x and below a fair ratio of 1.7x. This hints at valuation risk in both directions if sentiment or expectations change. Which signal do you put more weight on?
If you look at the numbers and reach a different conclusion, or simply prefer running your own checks, you can build a fresh view in just a few minutes with Do it your way.
A great starting point for your Ultra Clean Holdings research is our analysis highlighting 2 key rewards and 1 important warning sign that could impact your investment decision.
If Ultra Clean has sparked fresh thinking, do not stop here. Use the Simply Wall St screener to surface other focused ideas that might fit your watchlist.
This article by Simply Wall St is general in nature. We provide commentary based on historical data and analyst forecasts only using an unbiased methodology and our articles are not intended to be financial advice. It does not constitute a recommendation to buy or sell any stock, and does not take account of your objectives, or your financial situation. We aim to bring you long-term focused analysis driven by fundamental data. Note that our analysis may not factor in the latest price-sensitive company announcements or qualitative material. Simply Wall St has no position in any stocks mentioned.
