
Please use a PC Browser to access Register-Tadawul
Get It
Under Armour (UAA): Assessing Value Following Prolonged Share Price Decline
Under Armour, Inc. Class A UAA | 4.55 | +0.44% |
Under Armour's share price has been in a clear downtrend, with short-term momentum failing to reverse a tough streak. While the 1-day and 1-week share price returns are negative, the bigger concern is the nearly 30% decline in share price over the past three months. Looking at a broader time frame, the one-year total shareholder return sits at -49.5%. This indicates that recent drops have come in addition to longer-term underperformance. Investors appear to be shifting away amid ongoing uncertainty, so sentiment remains fragile for now.
If all this movement has you looking for fresh ideas, now is a smart time to discover fast growing stocks with high insider ownership
With Under Armour shares trading near multi-year lows and at a notable discount to analyst price targets, the central question for investors is clear: is there a true bargain here, or is the market already anticipating any future recovery?
Under Armour's narrative suggests its fair value sits well above the last close of $4.80, implying notable upside if the story plays out as expected. The stage is set by debates over the company's brand-first transformation, digital expansion, and its path to stronger profitability.
The ongoing transformation to a brand-first strategy, with a focus on premiumization, tighter SKU assortments, and greater brand storytelling positions Under Armour to increase average selling prices, improve full-price sell-through, and reduce reliance on discounting. This approach is expected to positively impact net margins and long-term earnings growth.
Want to know which bold assumptions are fueling this perceived upside? The secret lies in a unique blend of revenue projections, margin shifts, and future profit multiples. Uncover the pivotal numbers and find out what could power Under Armour’s comeback.
Result: Fair Value of $6.17 (UNDERVALUED)
However, persistent margin pressures from tariffs and continued weakness in key markets could quickly challenge even the most optimistic recovery story.
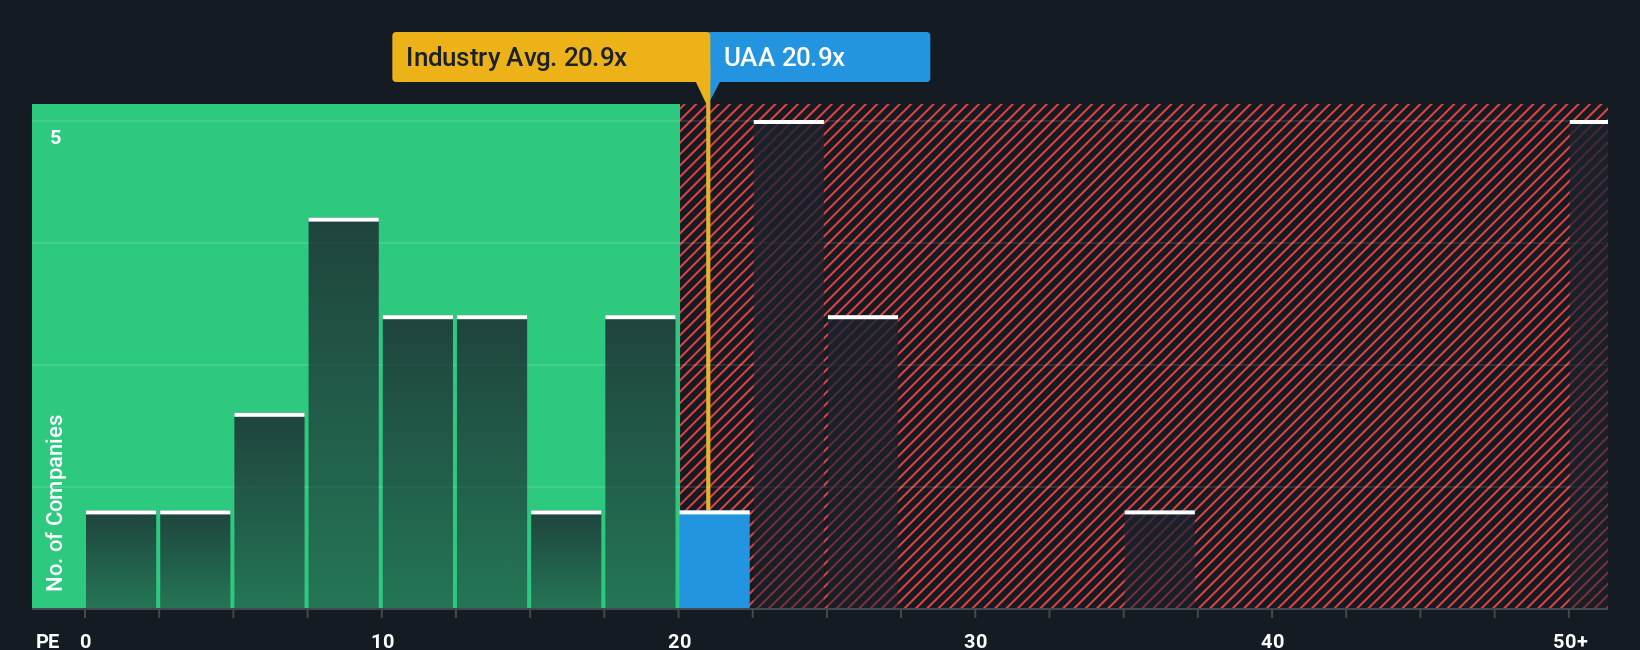
Looking beyond the analyst-driven fair value, Under Armour trades at a price-to-earnings ratio of 20.3x, which is higher than its peer average of 14.4x and the US Luxury industry's 19.9x. However, it still sits below its fair ratio of 25.5x, highlighting a nuanced valuation picture. This gap suggests both the potential for rerating and the risk of further devaluation. Will the market reward patience, or are challenges still ahead?
Simply Wall St performs a discounted cash flow (DCF) on every stock in the world every day (check out Under Armour for example). We show the entire calculation in full. You can track the result in your watchlist or portfolio and be alerted when this changes, or use our stock screener to discover undervalued stocks based on their cash flows. If you save a screener we even alert you when new companies match - so you never miss a potential opportunity.
If you see things differently or want to follow your own analysis, you can craft a personal narrative in just a few minutes: Do it your way
A great starting point for your Under Armour research is our analysis highlighting 2 key rewards and 1 important warning sign that could impact your investment decision.
Don't let standout opportunities pass you by. Grow your portfolio confidence with fresh angles and smart stock picks available through the Simply Wall Street Screener.
This article by Simply Wall St is general in nature. We provide commentary based on historical data and analyst forecasts only using an unbiased methodology and our articles are not intended to be financial advice. It does not constitute a recommendation to buy or sell any stock, and does not take account of your objectives, or your financial situation. We aim to bring you long-term focused analysis driven by fundamental data. Note that our analysis may not factor in the latest price-sensitive company announcements or qualitative material. Simply Wall St has no position in any stocks mentioned.
