Universal Technical Institute Q1 Margin Compression Challenges Bullish Growth Narratives

Universal Technical Institute, Inc. -3.63%

Universal Technical Institute, Inc.

UTI

30.57

-3.63%

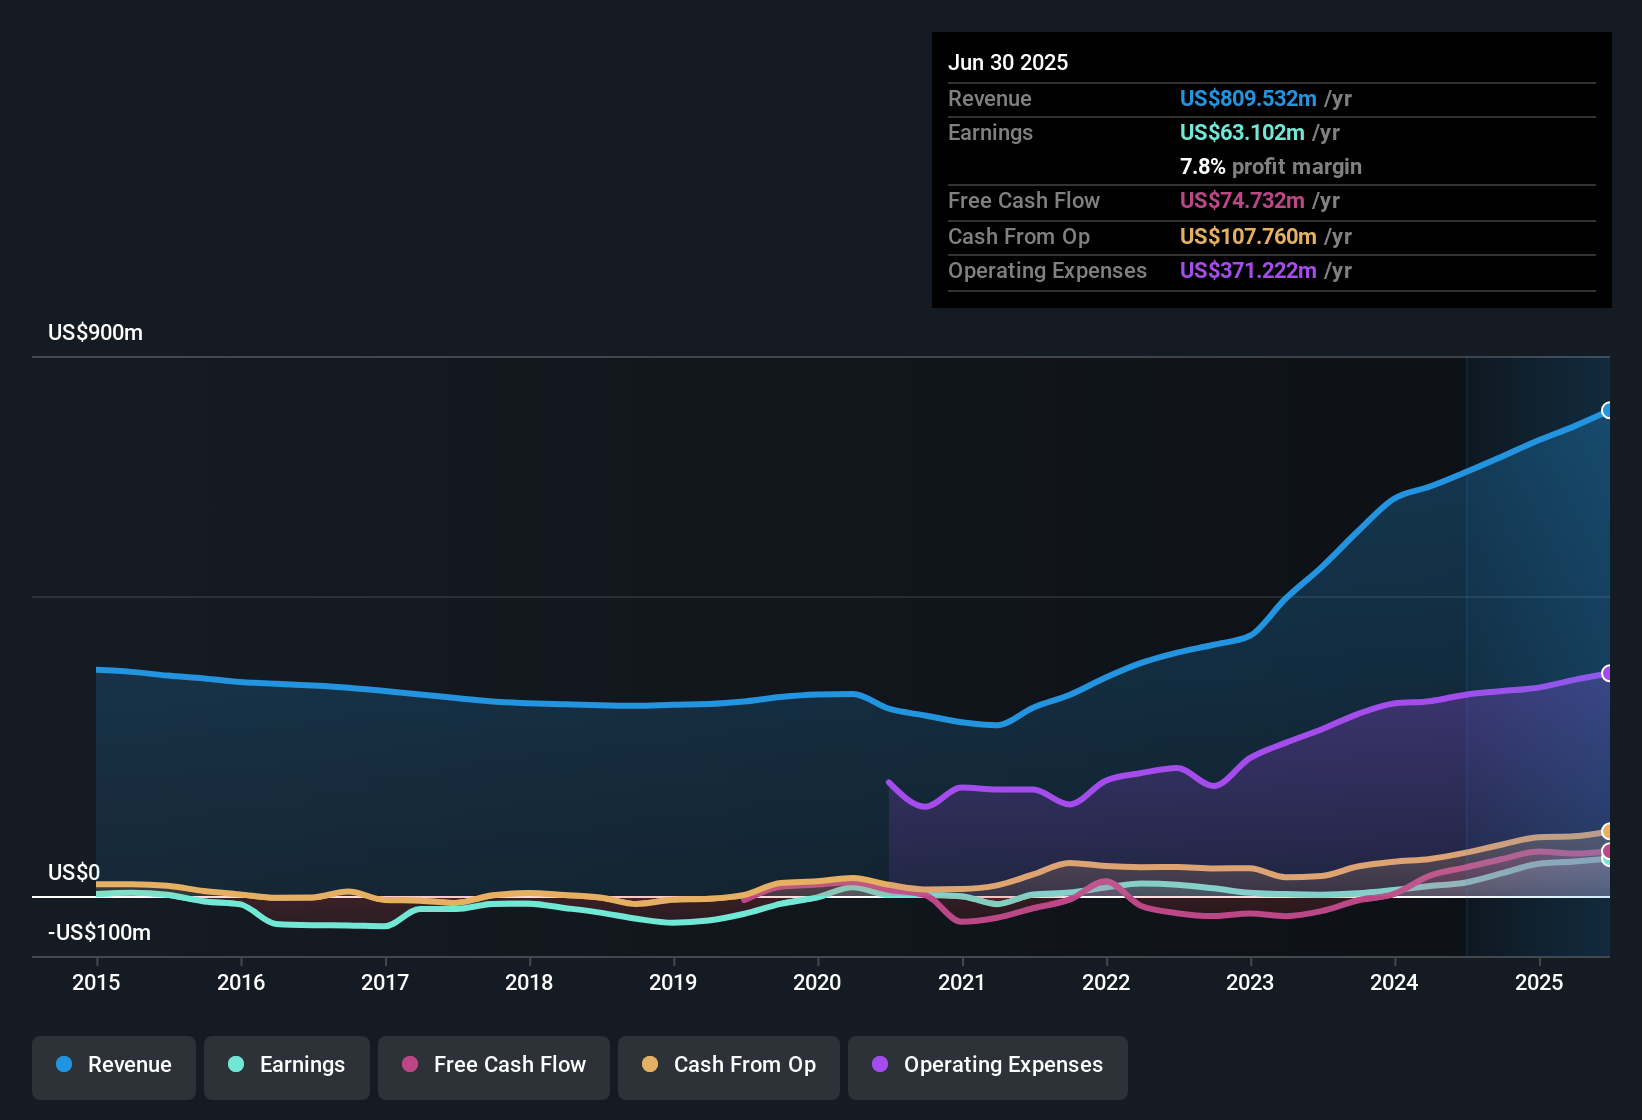
Universal Technical Institute (UTI) opened Q1 2026 with revenue of US$220.8 million and basic EPS of US$0.24, alongside net income excluding extras of US$12.8 million, setting a clear snapshot of its most recent quarter. The company reported revenue of US$201.4 million in Q1 2025 and US$220.8 million in Q1 2026, while basic EPS moved from US$0.41 to US$0.24 over the same period. This gives investors a mixed first impression and puts the focus squarely on how margins are evolving beneath the top line.

See our full analysis for Universal Technical Institute.

With the headline numbers on the table, the next step is to weigh them against the prevailing market and community narratives around UTI to see which views are reinforced and which are challenged by this latest earnings print.

NYSE:UTI Earnings & Revenue History as at Feb 2026

Trailing Margin Slips From 7.1% To 6.3%

  • On a trailing twelve month view, UTI’s net profit margin is 6.3%, compared with 7.1% a year ago, while net income excluding extras over that period sits at US$53.7 million on US$855.0 million of revenue.
  • What stands out for the bullish view that focuses on a 55.1% annual earnings growth rate over the past five years is that this softer margin arrives alongside that history. This means:
    • The 6.3% margin and US$53.7 million of trailing net income sit against a backdrop where the company only became profitable in the last five years, so any change in margin is likely to catch the eye of investors who pay close attention to profitability.
    • Bulls who lean on the longer term earnings growth record may also pay attention to how that 6.3% compares with the prior 7.1% level when they think about how sustainable that track record looks.

Earnings Forecasted To Outpace Revenue Growth

  • Current forecasts point to earnings growth of about 16.8% per year compared with roughly 8.3% per year for revenue. This implies that earnings are expected to grow roughly twice as fast as the top line on these figures.
  • Supporters of a bullish angle often highlight that kind of spread between earnings and revenue growth, and in this case:
    • The trailing twelve month revenue base of US$855.0 million and net income of US$53.7 million give those growth rates a clear starting point, so investors can see how much earnings are expected to change relative to the current level.
    • The forecast that earnings grow faster than revenue also sits next to the recent margin shift from 7.1% to 6.3%, which gives bulls and bears a concrete data point to debate when they talk about how that earnings growth might be achieved.

Rich Valuation Versus Peers And DCF

  • UTI’s share price of US$24.75 compares with a DCF fair value of US$4.66 and a P/E of 25.3x, which is above the peer average of 23.7x and above the US Consumer Services industry average of 16.6x, while analyst price targets of US$37.33 point to about 50.8% upside from the current price.
  • Skeptics who focus on valuation premium get plenty of data here to work with, and there is also material for those who point to analyst optimism:
    • The gap between the US$24.75 share price and the US$4.66 DCF fair value plus the above peer and industry P/E multiples is the kind of set up that investors who are cautious on valuation usually highlight.
    • At the same time, the difference between the US$24.75 price and the US$37.33 analyst target level is what those who see room for upside tend to point to when they argue that the market may be pricing UTI differently from those targets.

Analysts who track both the premium valuation and the margin trends may have very different conclusions about where the best risk reward sits for UTI. If you want to see how those viewpoints stack up across a full company breakdown, it can be helpful to read through a balanced narrative built around these numbers in more detail. 📊 Read the full Universal Technical Institute Consensus Narrative.

Next Steps

Don't just look at this quarter; the real story is in the long-term trend. We've done an in-depth analysis on Universal Technical Institute's growth and its valuation to see if today's price is a bargain. Add the company to your watchlist or portfolio now so you don't miss the next big move.

See What Else Is Out There

UTI combines a slipping net margin with a share price that sits above both its DCF fair value and peer P/E averages, which raises clear valuation questions.

If that kind of pricing premium makes you cautious, you might want to run your eye over our 55 high quality undervalued stocks to hunt for ideas that look cheaper on the numbers.

This article by Simply Wall St is general in nature. We provide commentary based on historical data and analyst forecasts only using an unbiased methodology and our articles are not intended to be financial advice. It does not constitute a recommendation to buy or sell any stock, and does not take account of your objectives, or your financial situation. We aim to bring you long-term focused analysis driven by fundamental data. Note that our analysis may not factor in the latest price-sensitive company announcements or qualitative material. Simply Wall St has no position in any stocks mentioned.

Every question you ask will be answered
Scan the QR code to contact us
whatsapp
Also you can contact us via