
Please use a PC Browser to access Register-Tadawul
Get It
US Market Undiscovered Gems To Watch In March 2025
Power Solutions International, Inc. PSIX | 62.95 | -4.27% |
Over the last 7 days, the United States market has experienced a 3.7% drop, yet it has shown resilience with a 6.9% rise over the past year and an optimistic forecast of 14% annual earnings growth. In this dynamic environment, identifying undiscovered gems involves finding stocks that demonstrate strong fundamentals and potential for growth amidst fluctuating market conditions.
| Name | Debt To Equity | Revenue Growth | Earnings Growth | Health Rating |
|---|---|---|---|---|
| Wilson Bank Holding | NA | 7.87% | 8.22% | ★★★★★★ |
| Cashmere Valley Bank | 15.51% | 5.80% | 3.51% | ★★★★★★ |
| ASA Gold and Precious Metals | NA | 7.47% | -26.86% | ★★★★★★ |
| Omega Flex | NA | -0.52% | 0.74% | ★★★★★★ |
| Teekay | NA | -0.89% | 62.53% | ★★★★★★ |
| Anbio Biotechnology | NA | 8.43% | 184.88% | ★★★★★★ |
| FRMO | 0.08% | 38.78% | 45.85% | ★★★★★☆ |
| Pure Cycle | 5.15% | -2.61% | -6.23% | ★★★★★☆ |
| First IC | 38.58% | 9.04% | 14.76% | ★★★★☆☆ |
| Reitar Logtech Holdings | 31.39% | 231.46% | 41.38% | ★★★★☆☆ |
Let's explore several standout options from the results in the screener.
Simply Wall St Value Rating: ★★★★☆☆
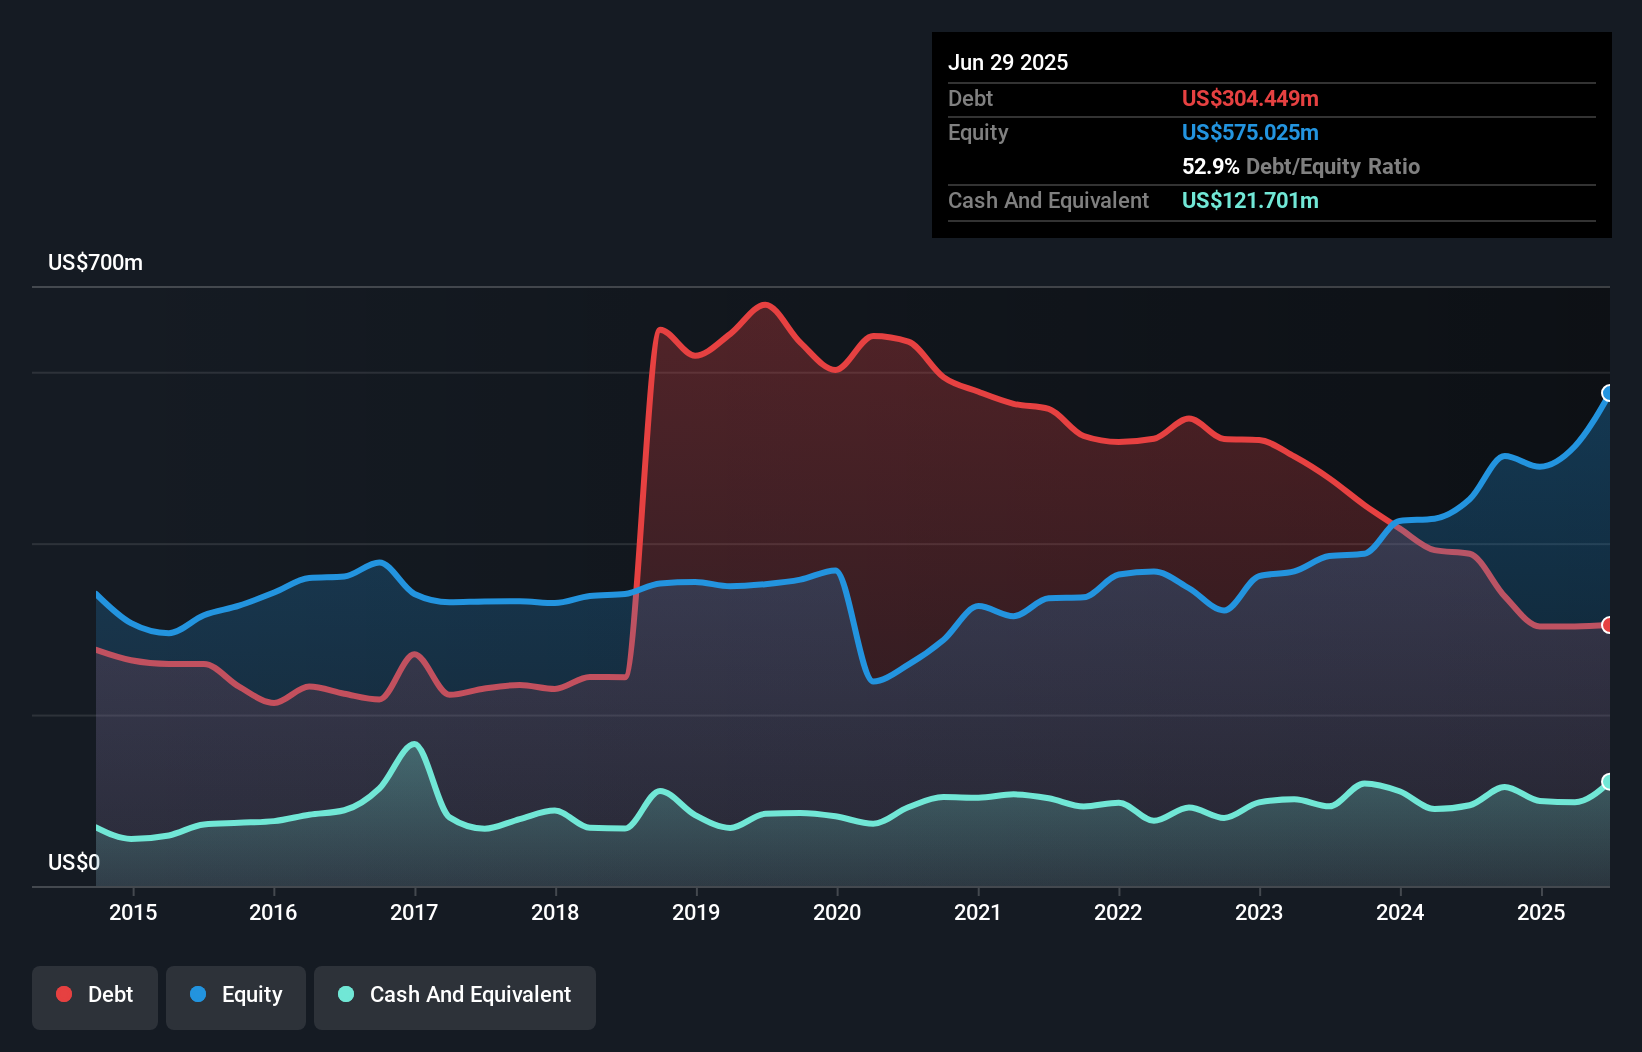
Overview: PrimeEnergy Resources Corporation, with a market cap of $315.69 million, focuses on the acquisition, development, and production of oil and natural gas properties in the United States through its subsidiaries.
Operations: PrimeEnergy generates revenue primarily from its oil and gas exploration, development, operation, and servicing activities, amounting to $210.06 million.
PrimeEnergy Resources, a small player in the energy sector, has shown impressive earnings growth of 65.7% over the past year, outpacing the broader oil and gas industry which saw a 22.1% decline. The company seems to be trading at a significant discount, valued at 94.3% below its estimated fair value. Over the last five years, PrimeEnergy's debt to equity ratio has improved dramatically from 57.5% to just 1.5%, indicating stronger financial health and reduced leverage concerns. However, recent insider selling could raise some eyebrows among potential investors considering future prospects in this volatile industry.
Simply Wall St Value Rating: ★★★★★☆
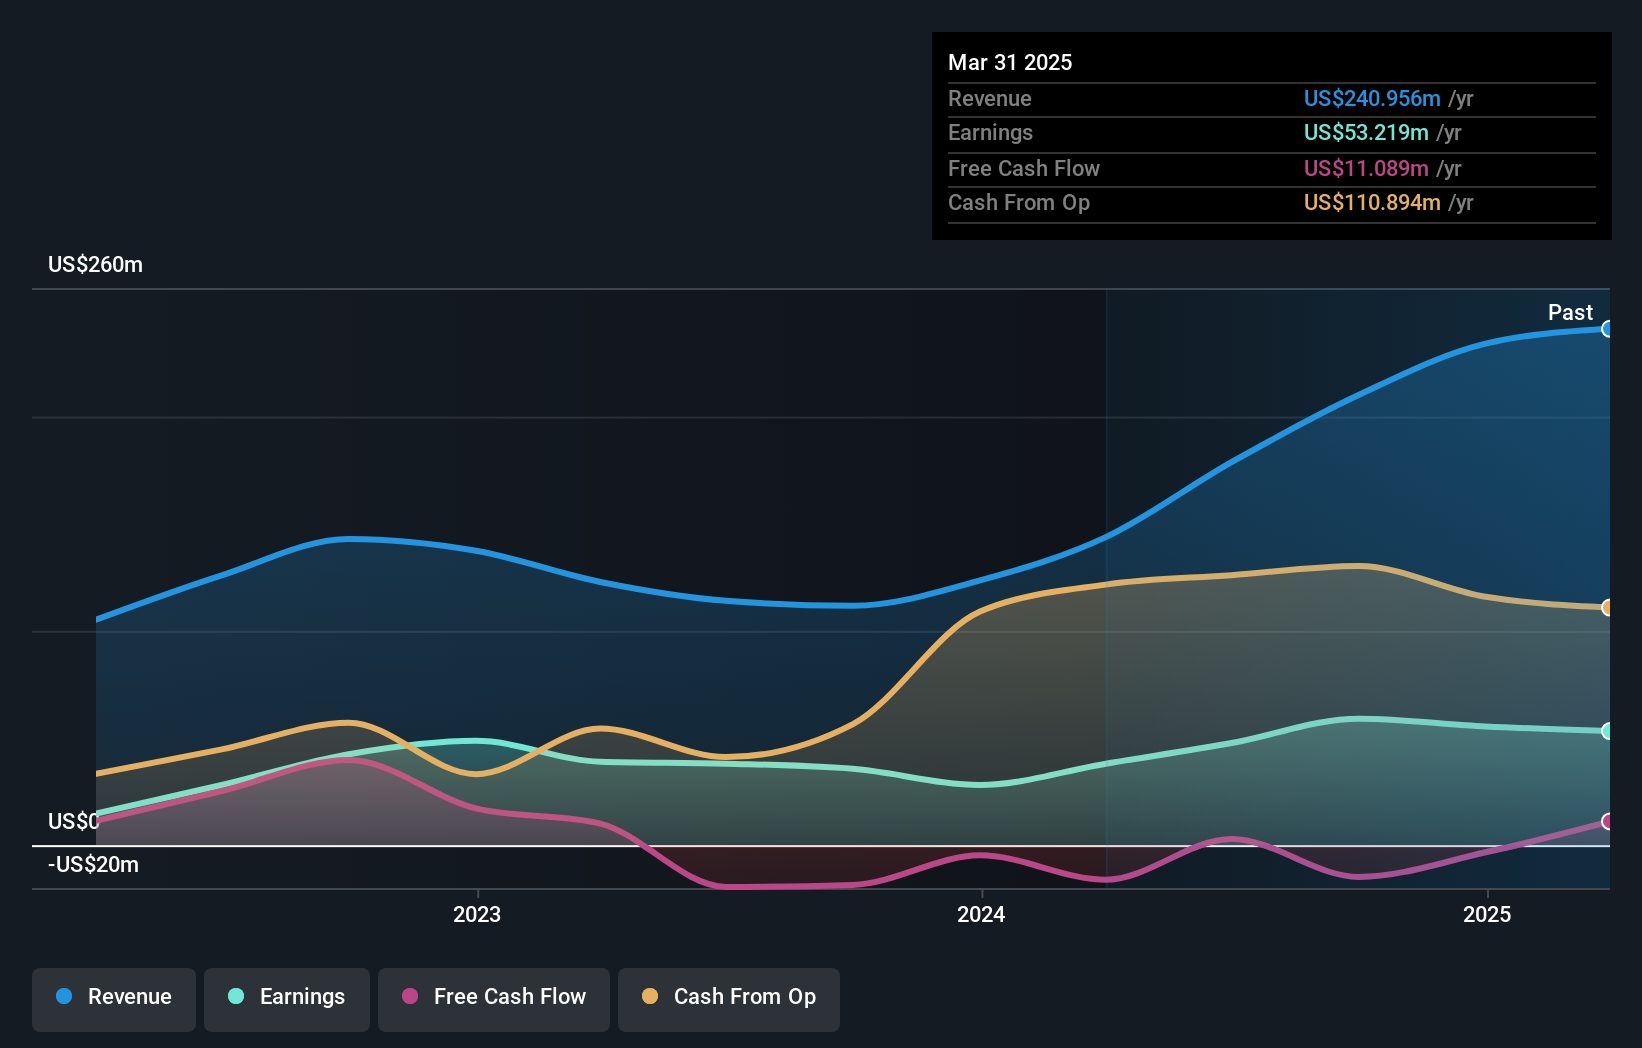
Overview: Power Solutions International, Inc. designs, engineers, manufactures, markets, and sells engines and power systems globally with a market cap of $623.29 million.
Operations: Power Solutions International generates revenue primarily from its Engineered Integrated Electrical Power Generation Systems, which contributed $436.42 million. The company's market cap stands at approximately $623.29 million.
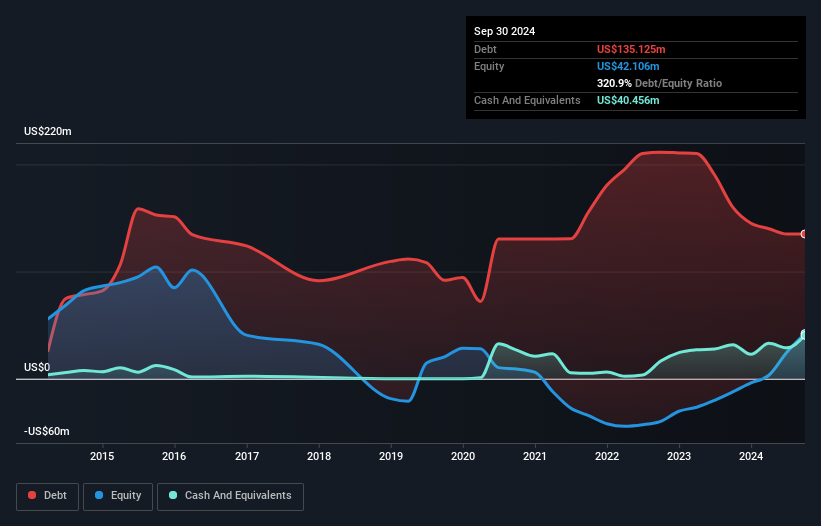
Power Solutions International, a small player in the energy sector, has recently made headlines by transitioning to the NASDAQ Composite Index. The company showcases robust earnings growth of 99.5% over the past year, far outpacing the electrical industry's -4.1%. Despite its high net debt to equity ratio of 224.8%, interest payments are well covered with EBIT at 5.1x coverage, indicating financial resilience amidst volatility in share price and insider selling activity. Trading at a value 32.7% below estimated fair value suggests potential upside for investors seeking undervalued opportunities in this dynamic industry space.
Simply Wall St Value Rating: ★★★★★☆
Overview: Interface, Inc. designs, produces, and sells modular carpet products across various regions including the United States, Canada, Latin America, Europe, Africa, Asia, and Australia with a market cap of approximately $1.09 billion.
Operations: Interface generates revenue primarily from two segments: Americas, contributing $800.81 million, and Europe, Africa, Asia, and Australia (EAAA), adding $514.85 million.
Interface is making strides in the modular carpet industry by leveraging integrated selling and supply chain optimization to enhance productivity. The company is investing in automation and robotics, which seems to be improving operational efficiency, while also focusing on sustainability with a goal of carbon negativity by 2040. Interface's debt-to-equity ratio has impressively reduced from 163.5% to 61.9% over five years, reflecting financial discipline. Additionally, its net debt to equity ratio stands at a high 41.6%, indicating room for improvement in managing leverage. Despite challenges like macroeconomic pressures in Europe and Australia, earnings grew by an impressive 99.6% last year, outpacing the Commercial Services industry growth of 7.2%. Recent product launches such as the Trina Turk X FLOR collection have been well-received, with over 57,000 tiles sold since February 2024—20% of these sales are attributed to commercial spaces—demonstrating strong market traction beyond residential interiors.
This article by Simply Wall St is general in nature. We provide commentary based on historical data and analyst forecasts only using an unbiased methodology and our articles are not intended to be financial advice. It does not constitute a recommendation to buy or sell any stock, and does not take account of your objectives, or your financial situation. We aim to bring you long-term focused analysis driven by fundamental data. Note that our analysis may not factor in the latest price-sensitive company announcements or qualitative material. Simply Wall St has no position in any stocks mentioned.
