Virginia National Bankshares (VABK) closed out FY 2025 with fourth quarter total revenue of US$15.1 million and basic EPS of US$1.10, while trailing twelve month revenue came in at US$57.5 million and EPS at US$3.57. The company has seen total revenue range from US$13.6 million to US$15.1 million per quarter over the past year, with quarterly EPS between roughly US$0.79 and US$1.10 feeding into trailing twelve month net income of US$19.3 million. With net profit margins and dividend income both in focus, investors are likely to pay close attention to how these earnings levels support the current payout and overall profitability profile.
See our full analysis for Virginia National Bankshares.
With the headline numbers on the table, the next step is to compare them with the most widely held narratives about Virginia National Bankshares to see which stories are backed by the data and which ones are challenged by it.
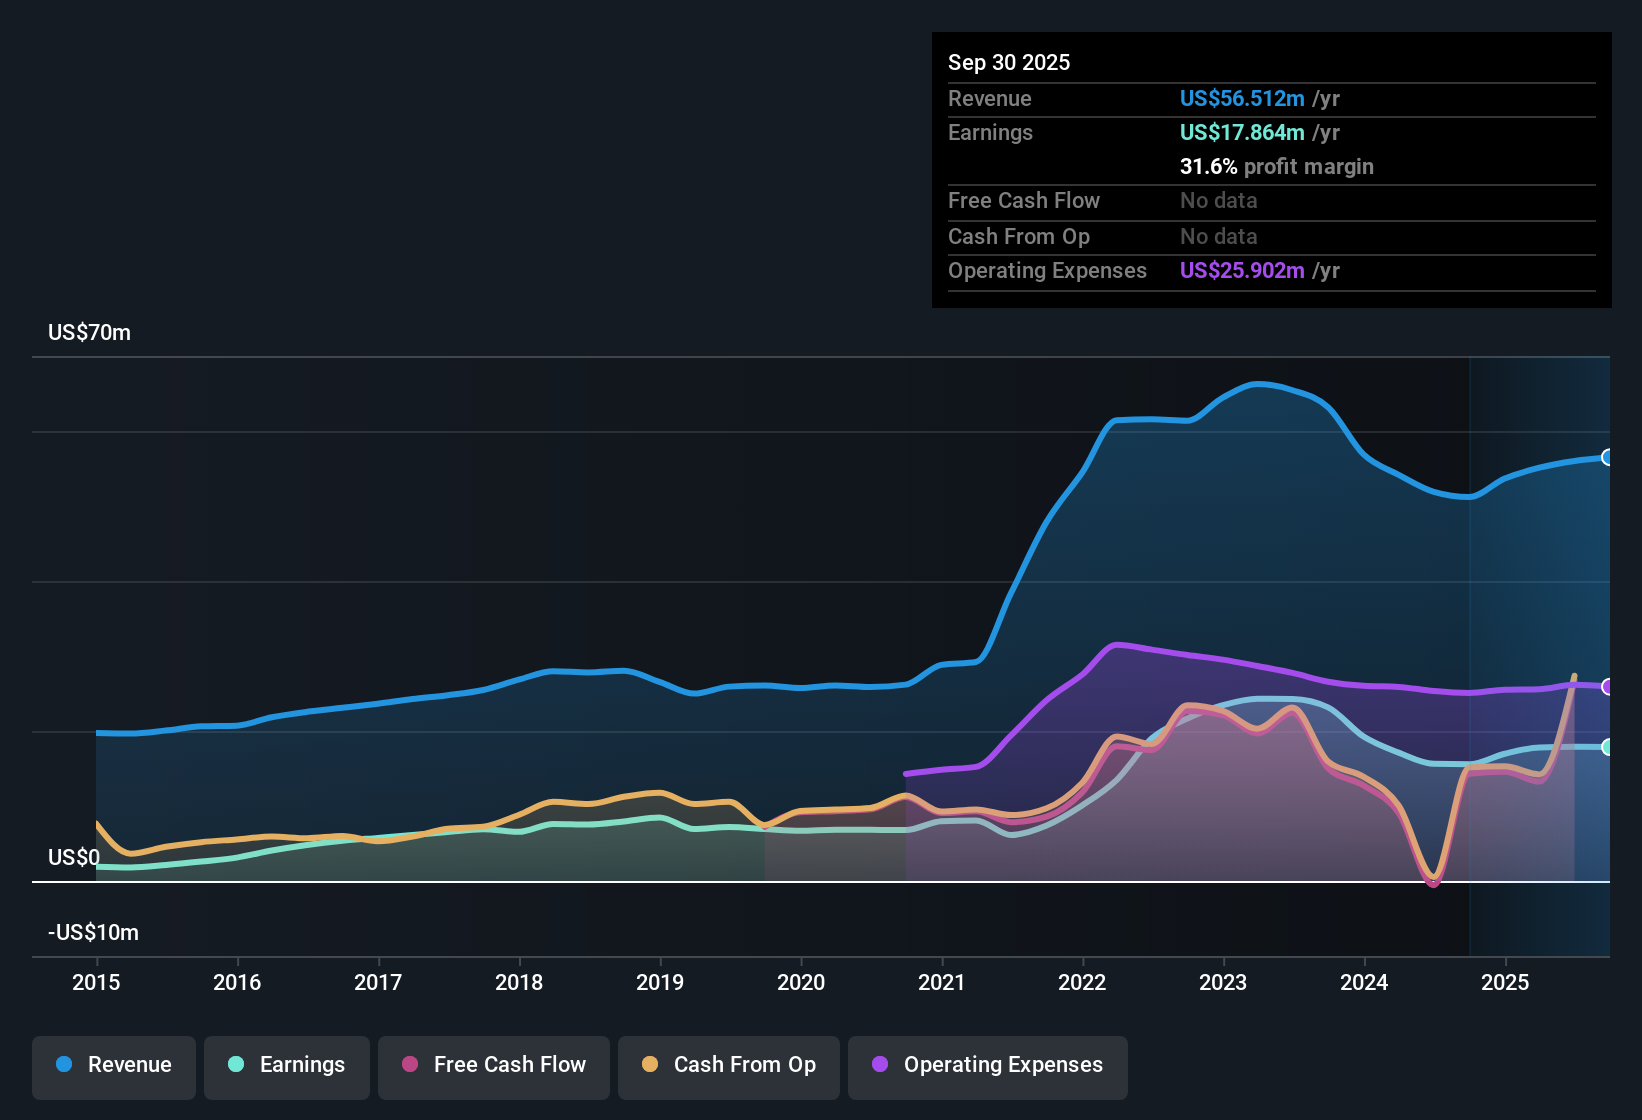
NasdaqCM:VABK Earnings & Revenue History as at Jan 2026
Margins and costs hold steady around 60%
Virginia National Bankshares reported net profit margins of 31.6% over the last 12 months, alongside cost to income ratios between 57.9% and 62.4% in recent quarters. This indicates a substantial portion of each revenue dollar is still dropping through after operating costs.
For a bullish view, what stands out is how profitability lines up with this cost base. Trailing twelve month net income of US$19.3 million and EPS of US$3.57 sit alongside quarterly net interest margins in the low 3% range, between 3.1% and 3.43%. This suggests earnings quality is being supported rather than driven by a single unusually strong quarter.
Bulls often look for consistency, and here the recent quarterly cost to income ratio stayed in a fairly tight band, from 57.9% in Q3 FY 2025 to 62.4% in Q1 FY 2025, instead of swinging widely.
At the same time, the year over year move in net profit margin from 30.4% to 31.6% aligns with the 14.7% trailing earnings growth. This supports the bullish case that profitability has been running at healthy levels across the period rather than relying on one off items.
Over the last year of results, bulls argue that these steady margins and costs help explain how the bank converted US$57.5 million of revenue into a 3.54% dividend yield without stretching its income statement.
🐂 Virginia National Bankshares Bull Case
Loan book stable, credit quality in focus
Total loans have stayed just above US$1.2b across the reported periods, with quarterly balances such as US$1,242.5 million in Q1 FY 2025 and US$1,235.0 million in Q3 FY 2025. Non performing loans moved within a range of US$3.0 million to US$7.8 million, so credit quality is an area to watch even though the loan book size itself has been steady.
Critics highlight credit risk as a key area to track, and the provided figures give them some concrete data to work with. Non performing loans rose from US$3.0 million in Q4 FY 2024 to US$7.8 million in Q2 FY 2025 before easing back to US$6.8 million in Q3 FY 2025, which allows bears to point to fluctuations in problem loans rather than a smooth line.
This pattern does not match a simple story of uninterrupted asset quality improvement, so it partly challenges a strongly bullish narrative that might otherwise lean only on earnings growth and margins.
On the other hand, non performing loans remain a small fraction of a loan book above US$1.2b, which limits how far a bearish case can stretch these figures without appearing disconnected from the scale of the balance sheet.
P/E premium versus DCF fair value gap
The bank trades on a trailing P/E of 12.3x compared with 11.7x for the US Banks industry and 11.3x for peers. Yet the current share price of US$40.69 sits below a DCF fair value of about US$64.79, implying the shares are roughly 37.3% under that cash flow based estimate even though the multiple is higher than averages.
For a bullish narrative, the mix of numbers is notable. The 13% five year compound earnings growth rate and 14.7% trailing earnings growth are paired with a 3.54% dividend yield and the DCF fair value of US$64.79. Together, these points support the idea that the current P/E premium might be reflecting solid profitability rather than an extreme stretch.
Supporters can point out that the P/E gap to peers is relatively small, around 0.6x to the industry and 1.0x to peers, while the DCF estimate points to a far larger difference between price and implied value.
At the same time, skeptics who focus on simple multiples can still argue the stock is not the cheapest name in the group, so investors have to weigh the higher P/E against the cash flow based valuation and dividend profile backed by US$
Next Steps
Don't just look at this quarter; the real story is in the long-term trend. We've done an in-depth analysis on Virginia National Bankshares's growth and its valuation to see if today's price is a bargain. Add the company to your watchlist or portfolio now so you don't miss the next big move.
See What Else Is Out There
While margins and earnings look solid, the premium P/E against peers and the tension with the DCF estimate mean valuation is a clear sticking point for some investors.
If that premium worries you, use our CTA_SCREENER_UNDERVALUED to quickly focus on companies where price and cash flow based estimates currently look more closely aligned.
This article by Simply Wall St is general in nature. We provide commentary based on historical data and analyst forecasts only using an unbiased methodology and our articles are not intended to be financial advice. It does not constitute a recommendation to buy or sell any stock, and does not take account of your objectives, or your financial situation. We aim to bring you long-term focused analysis driven by fundamental data. Note that our analysis may not factor in the latest price-sensitive company announcements or qualitative material. Simply Wall St has no position in any stocks mentioned.