
Please use a PC Browser to access Register-Tadawul
Get It
Vistra Shares Slide 9% but Power Grid Investments Shift Growth Outlook for 2025
Vistra Energy Corp. VST | 170.10 | -2.58% |
If you’ve been watching Vistra lately and wondering what your move should be, you’re not alone. The stock has been on a rollercoaster that would make even seasoned investors pause for a second look. Over just the past week, Vistra dropped 9.0%, a decline that caught some off guard. Zoom out to the past month, and it’s still showing a 6.3% decline. However, before you worry this is the end of the story, consider the longer-term numbers. Vistra is up a massive 27.9% year-to-date, a striking 53.3% over the last year, and an impressive 815.3% over the last three years. If you had entered the market five years ago, your return would be over 1,100%.
So, what’s moving Vistra now? Recent news has focused on industry updates regarding power grid investments and strengthened clean energy initiatives. These developments highlight the company’s evolving role in meeting energy demand and enhancing grid resilience. Such changes have influenced how investors view Vistra’s risk and growth prospects, shifting the narrative from cautious optimism to stronger conviction in the company’s expansion and strategic decisions.
Now, when it comes to the question of value, Vistra scores a 4 out of 6 on our valuation check. This means the company is undervalued in four out of six major ways analysts typically measure. That is notable for a stock with such a dynamic price history. Let’s break down what those valuation methods really mean, and stick with me, because I’ll show you an even better way to judge whether Vistra is truly undervalued by the time we’re done.
The Discounted Cash Flow (DCF) model is a foundational valuation method that estimates a company's intrinsic value by forecasting its future cash flows and discounting them back to their worth today. This approach is especially useful for companies with clear records of free cash flow generation, like Vistra.
Currently, Vistra generates Free Cash Flow of $1.47 Billion. According to analyst consensus, this number is projected to grow significantly, reaching $6.01 Billion in 2029. In fact, ten-year projections from analysts and other extrapolations suggest Free Cash Flow could approach $9.29 Billion annually by 2035. These figures reflect a robust anticipated growth in profitability and the underlying business.
Based on these forecasts and using a two-stage Free Cash Flow to Equity model, the DCF analysis estimates Vistra's intrinsic value at $424.30 per share. Compared to its present market price, this implies the stock is trading at a 54.9% discount, making it look substantially undervalued by this measure.
Result: UNDERVALUED
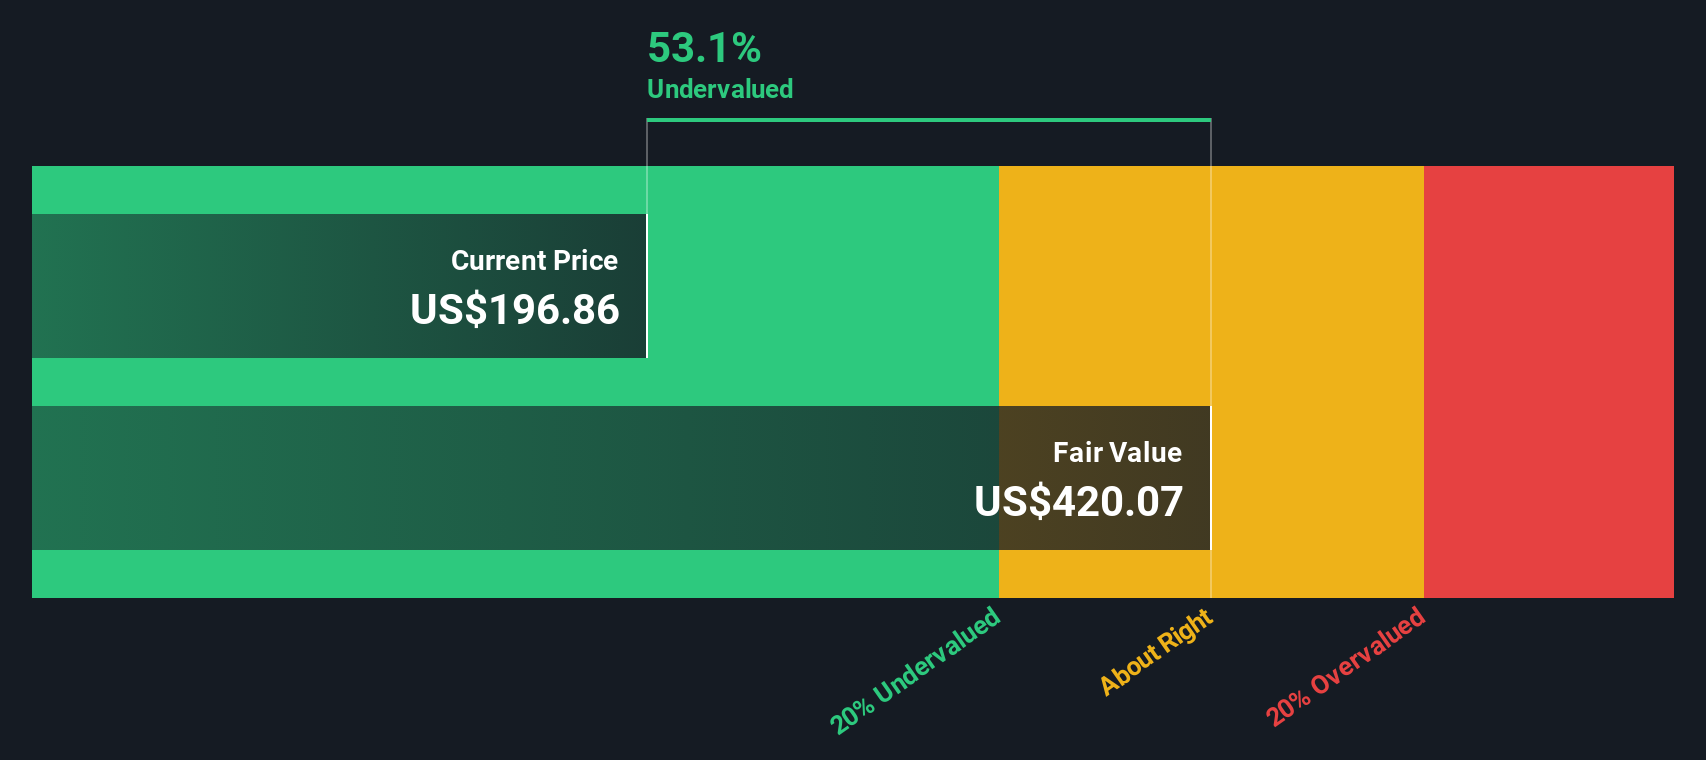
Our Discounted Cash Flow (DCF) analysis suggests Vistra is undervalued by 54.9%. Track this in your watchlist or portfolio, or discover more undervalued stocks.
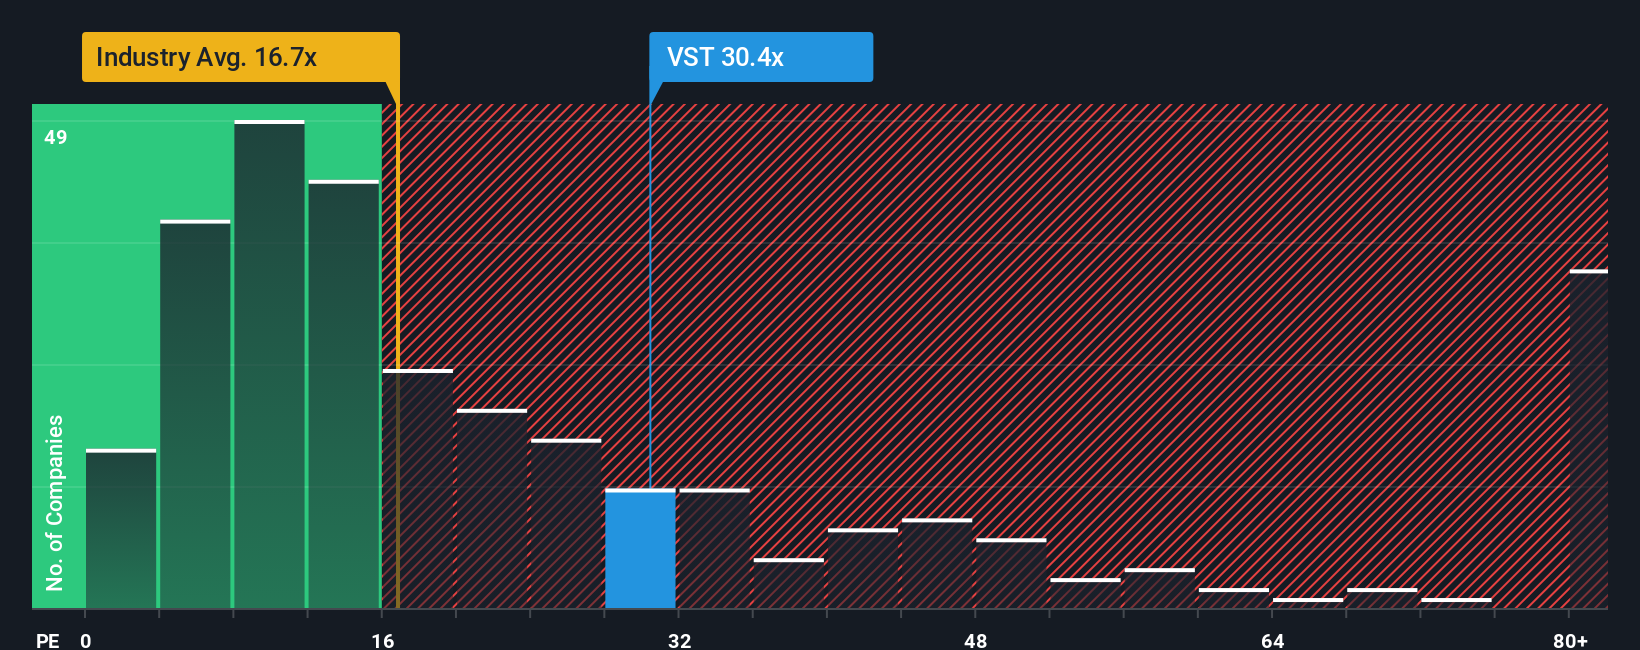
The Price-to-Earnings (PE) ratio is a go-to valuation metric for profitable companies like Vistra because it relates the stock price directly to company earnings. For investors, the PE ratio offers a quick way to check whether the market is pricing the company’s profits too high or too low compared to others.
Several factors influence what counts as a "fair" PE ratio, with the biggest being future growth expectations and company-specific risks. Higher anticipated earnings growth and lower risk tend to justify a higher PE, while more risk or slower growth usually suggest a lower one.
At the moment, Vistra’s PE ratio stands at 29.5x. Compared to the Renewable Energy industry average of 16.7x and a peer group average of 35.0x, Vistra’s earnings are valued above the industry but slightly below peers. However, comparing only to the industry or competitors does not capture the bigger picture.
This is where the Fair Ratio comes in. Developed by Simply Wall St, the Fair Ratio estimates what Vistra’s PE ratio should be, adjusting for its earnings growth, profit margins, size, industry, and risk profile. This personalized benchmark provides a more accurate view than simple industry or peer comparisons.
Vistra’s Fair Ratio is 40.8x, notably higher than its current PE of 29.5x. This suggests the stock is trading below where it should be given all the relevant factors and may offer value at its current price.
Result: UNDERVALUED
PE ratios tell one story, but what if the real opportunity lies elsewhere? Discover companies where insiders are betting big on explosive growth.
Earlier we mentioned that there is an even better way to understand valuation, so let’s introduce you to Narratives. A Narrative is simply your own story and outlook about a company like Vistra, backed up with your assumptions, such as future revenues, earnings, and profit margins, which all connect to your estimate of what the stock is really worth.
Narratives link the bigger picture, such as Vistra’s leadership in grid modernization or exposure to changing power markets, to a specific financial forecast and ultimately to a fair value for the stock. This is not just for experts; on Simply Wall St’s Community page, millions of investors create, update, and compare these Narratives every day.
With Narratives, you can decide when to buy or sell by seeing how your fair value stacks up against the current share price. They also respond dynamically to new company results or news. For Vistra, one investor might see rapid AI-driven electricity demand, boosting earnings and setting a high price target, while another focuses on regulatory risk or fast-changing competition, which could lead to a lower value. Narratives help you visualize the impact of different outlooks so you can decide with confidence.
Do you think there's more to the story for Vistra? Create your own Narrative to let the Community know!
This article by Simply Wall St is general in nature. We provide commentary based on historical data and analyst forecasts only using an unbiased methodology and our articles are not intended to be financial advice. It does not constitute a recommendation to buy or sell any stock, and does not take account of your objectives, or your financial situation. We aim to bring you long-term focused analysis driven by fundamental data. Note that our analysis may not factor in the latest price-sensitive company announcements or qualitative material. Simply Wall St has no position in any stocks mentioned.
