
Please use a PC Browser to access Register-Tadawul
Get It
What Does the Latest Infrastructure Bill Mean for AECOM’s Share Price in 2025?
AECOM ACM | 98.85 98.85 | -1.11% 0.00% Pre |
Thinking about what to do with AECOM stock right now? You are not alone. Investors often debate whether this infrastructure giant is still a buy after its big run or if the price is starting to get ahead of itself. Over the last five years, AECOM’s stock has surged an impressive 187.1%, and even over the past year, it has climbed 23.7%. With a steady 21.3% jump year to date, a modest 1.8% increase in the last month, and just a slight dip of -0.7% in the past week, there is a clear message: the market sees ongoing potential, though not without some short-term volatility.
These swings often reflect broader confidence in infrastructure expansion and the global trend toward sustainable development. These factors have kept investors engaged. However, if you are sizing up your next move, valuation is key. According to our checks, AECOM scores a 2 out of 6 for undervaluation, highlighting it passes a couple of important measures, but not all. So, how do we make sense of the numbers, and are traditional valuation metrics enough? Next, we are going to break down different valuation approaches and later, introduce an even sharper way to size up what AECOM is really worth.
AECOM scores just 2/6 on our valuation checks. See what other red flags we found in the full valuation breakdown.
The Discounted Cash Flow (DCF) model estimates a company's intrinsic value by projecting future cash flows and then discounting them back to their value today. This approach is widely used to determine what a business is truly worth, independent of short-term market swings.
For AECOM, the most recently reported Free Cash Flow (FCF) is $795.9 million. While analysts directly estimate only the next five years, Simply Wall St extrapolates future projections to create a ten-year forecast. For 2026, FCF is expected to be $681.4 million, and a decade from now, the model estimates AECOM will generate around $820.9 million in annual free cash flow. All figures are reported in US dollars. These cash flows are then discounted to present value using a 2 Stage Free Cash Flow to Equity model.
According to the DCF analysis, AECOM’s fair value is calculated at $86.07 per share. When compared to the current market price, the model finds the stock to be about 49.8% overvalued. This indicates the market price is significantly ahead of what the discounted cash flows suggest the business is worth today.
Result: OVERVALUED
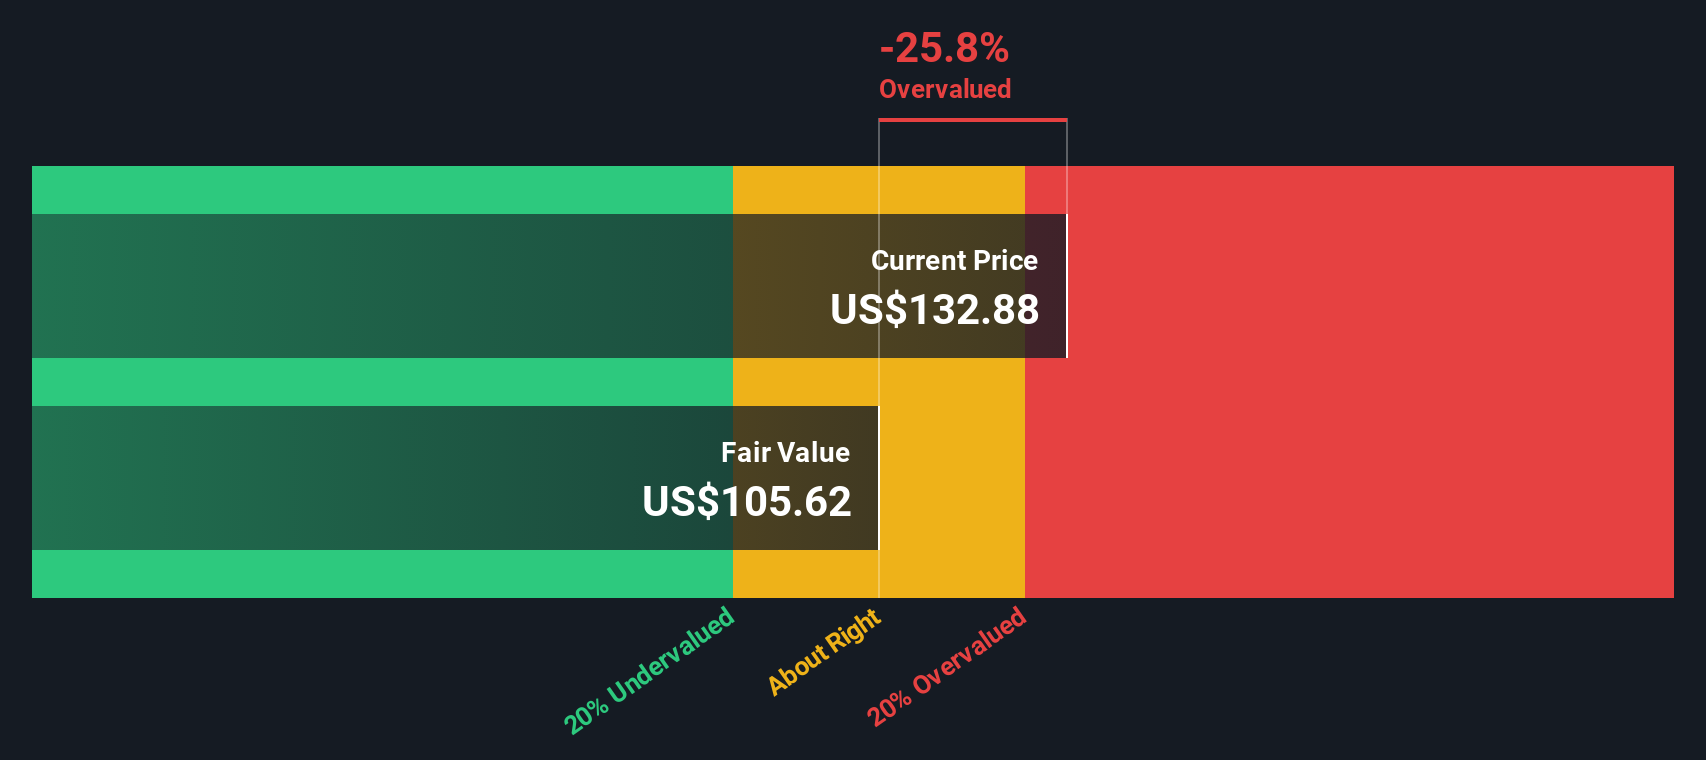
Our Discounted Cash Flow (DCF) analysis suggests AECOM may be overvalued by 49.8%. Find undervalued stocks or create your own screener to find better value opportunities.
The Price-to-Earnings (PE) ratio is a widely used valuation metric for profitable companies like AECOM because it relates the share price directly to the company’s earnings. For businesses generating steady profits, especially in established sectors like construction, the PE ratio helps investors gauge how much they are paying for each dollar of earnings.
What counts as a “fair” PE ratio will depend on several factors, including growth expectations and risk. Companies with higher growth prospects or lower risks typically trade at higher PE multiples, while slower growers or riskier businesses attract lower multiples. This context is crucial when sizing up AECOM’s valuation.
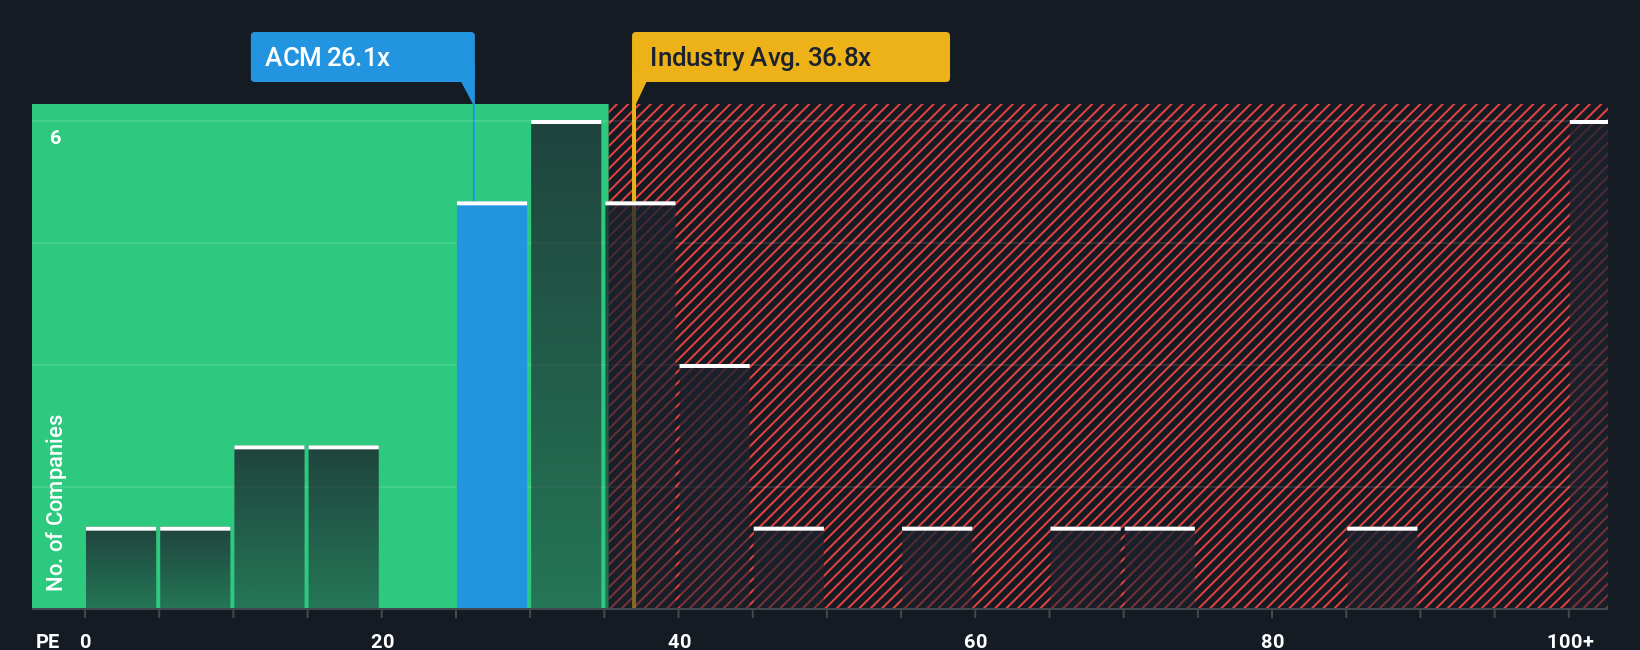
At present, AECOM trades at a PE ratio of 25x. By comparison, its industry peers have an average PE of 57x, and the wider construction sector average is about 36x. This means AECOM’s shares are priced beneath both the peer and industry norms in terms of earnings, which is often seen as a positive starting point.
To go a step further, Simply Wall St calculates a proprietary “Fair Ratio” for AECOM, which reflects not just simple earnings comparisons but also considers earnings growth, profit margins, risk, market cap, and the broader industry climate. This tailored number provides a more nuanced reference point because it weighs all the key factors influencing a fair price. AECOM’s Fair PE Ratio works out to 23x, which is slightly lower than its current 25x multiple.
Given this small difference, it appears AECOM is being valued by the market about as expected for its strengths and risks. In other words, the market price is aligned with what you might expect given its fundamentals and outlook.
Result: ABOUT RIGHT
PE ratios tell one story, but what if the real opportunity lies elsewhere? Discover companies where insiders are betting big on explosive growth.
Earlier we mentioned there is an even better way to understand valuation, so let us introduce you to Narratives. A Narrative is your personal investment storyline, a structured way to connect your view of a company’s prospects with actual numbers, such as your own fair value, revenue, and profit forecasts. Narratives help investors bridge the gap between financial data and real-world context, making it easier to see how a company’s underlying story translates into projected performance and investment decisions.
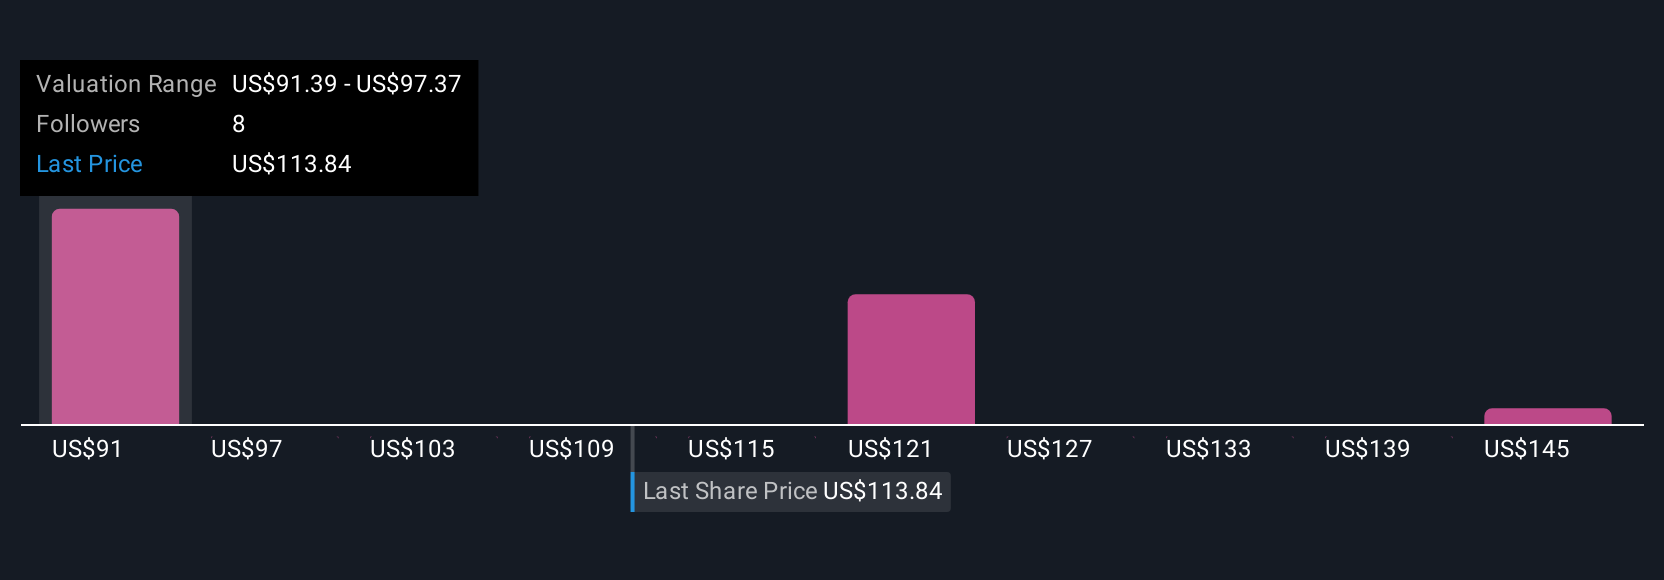
Simply Wall St’s platform makes this powerful tool accessible and intuitive: within the Community page, millions of investors craft and share Narratives, articulating why they believe a stock like AECOM is a buy, sell, or hold, underpinned by their assumptions and outlook. Narratives dynamically update as new information or results are released, ensuring your perspective is always in tune with the latest developments. For example, some investors see government infrastructure investment and digital transformation driving AECOM’s fair value as high as $145.0, while others, wary of execution risks and headwinds, estimate it closer to $109.0. Narratives let you compare your own conviction, by weighing fair value against today's price, with those of the broader community, helping you decide on your next move with more clarity and confidence.
Decide for yourself: Is AECOM’s story, matched to your numbers, worth buying into at today’s price?
Do you think there's more to the story for AECOM? Create your own Narrative to let the Community know!
This article by Simply Wall St is general in nature. We provide commentary based on historical data and analyst forecasts only using an unbiased methodology and our articles are not intended to be financial advice. It does not constitute a recommendation to buy or sell any stock, and does not take account of your objectives, or your financial situation. We aim to bring you long-term focused analysis driven by fundamental data. Note that our analysis may not factor in the latest price-sensitive company announcements or qualitative material. Simply Wall St has no position in any stocks mentioned.
