
Please use a PC Browser to access Register-Tadawul
Get It
What You Can Learn From FingerMotion, Inc.'s (NASDAQ:FNGR) P/S After Its 33% Share Price Crash
FingerMotion Inc FNGR | 1.20 1.20 | -2.44% 0.00% Post |
FingerMotion, Inc. (NASDAQ:FNGR) shares have had a horrible month, losing 33% after a relatively good period beforehand. Instead of being rewarded, shareholders who have already held through the last twelve months are now sitting on a 41% share price drop.
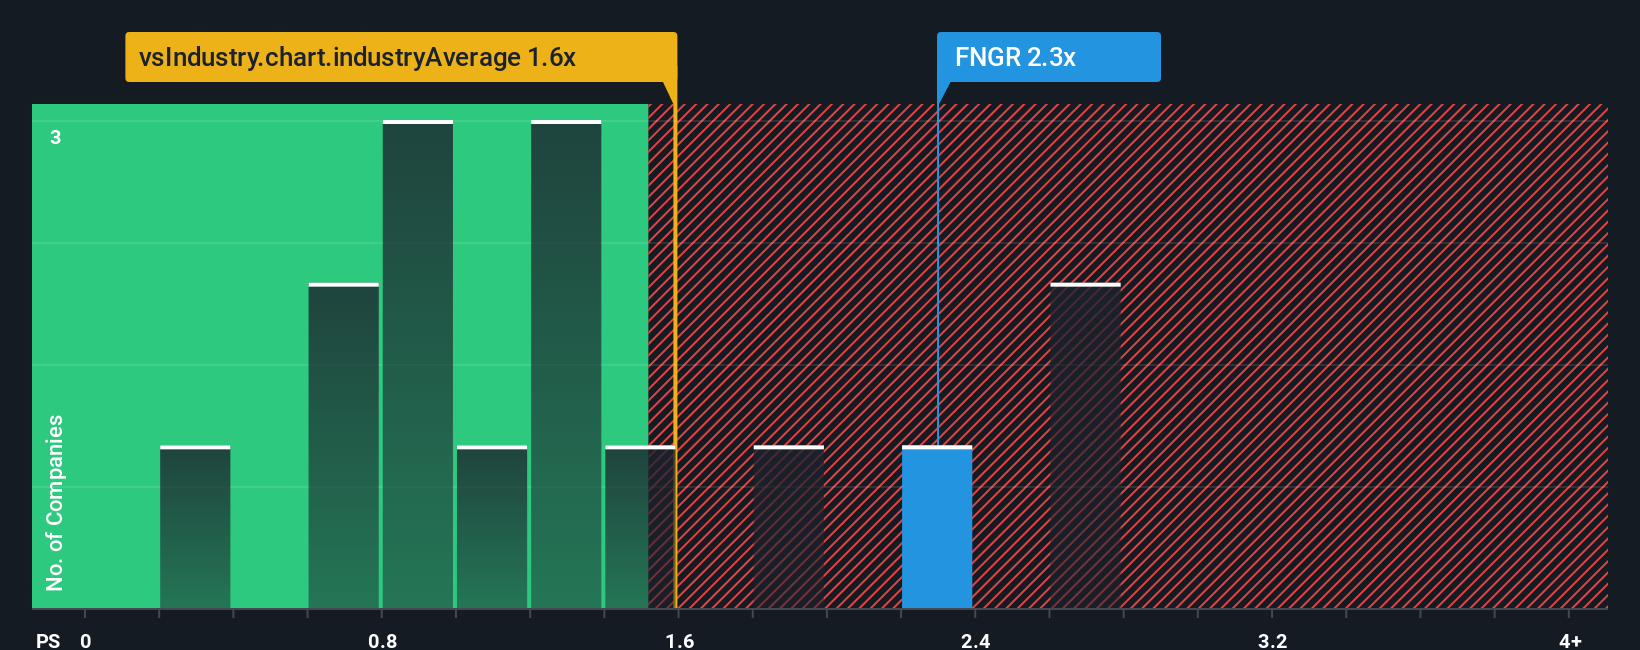
Even after such a large drop in price, you could still be forgiven for thinking FingerMotion is a stock not worth researching with a price-to-sales ratios (or "P/S") of 2.3x, considering almost half the companies in the United States' Wireless Telecom industry have P/S ratios below 1.2x. Although, it's not wise to just take the P/S at face value as there may be an explanation why it's as high as it is.
FingerMotion has been doing a good job lately as it's been growing revenue at a solid pace. One possibility is that the P/S ratio is high because investors think this respectable revenue growth will be enough to outperform the broader industry in the near future. You'd really hope so, otherwise you're paying a pretty hefty price for no particular reason.
Although there are no analyst estimates available for FingerMotion, take a look at this free data-rich visualisation to see how the company stacks up on earnings, revenue and cash flow.FingerMotion's P/S ratio would be typical for a company that's expected to deliver solid growth, and importantly, perform better than the industry.
Taking a look back first, we see that the company grew revenue by an impressive 15% last year. Pleasingly, revenue has also lifted 68% in aggregate from three years ago, thanks to the last 12 months of growth. So we can start by confirming that the company has done a great job of growing revenue over that time.
This is in contrast to the rest of the industry, which is expected to grow by 7.0% over the next year, materially lower than the company's recent medium-term annualised growth rates.
With this information, we can see why FingerMotion is trading at such a high P/S compared to the industry. Presumably shareholders aren't keen to offload something they believe will continue to outmanoeuvre the wider industry.
There's still some elevation in FingerMotion's P/S, even if the same can't be said for its share price recently. We'd say the price-to-sales ratio's power isn't primarily as a valuation instrument but rather to gauge current investor sentiment and future expectations.
As we suspected, our examination of FingerMotion revealed its three-year revenue trends are contributing to its high P/S, given they look better than current industry expectations. In the eyes of shareholders, the probability of a continued growth trajectory is great enough to prevent the P/S from pulling back. Unless the recent medium-term conditions change, they will continue to provide strong support to the share price.
Having said that, be aware FingerMotion is showing 3 warning signs in our investment analysis, and 1 of those doesn't sit too well with us.
If these risks are making you reconsider your opinion on FingerMotion, explore our interactive list of high quality stocks to get an idea of what else is out there.
This article by Simply Wall St is general in nature. We provide commentary based on historical data and analyst forecasts only using an unbiased methodology and our articles are not intended to be financial advice. It does not constitute a recommendation to buy or sell any stock, and does not take account of your objectives, or your financial situation. We aim to bring you long-term focused analysis driven by fundamental data. Note that our analysis may not factor in the latest price-sensitive company announcements or qualitative material. Simply Wall St has no position in any stocks mentioned.
