
Please use a PC Browser to access Register-Tadawul
Get It
Where Does Bread Financial Stand After 33% Gain and Recent Earnings Volatility?
Bread Financial Holdings, Inc. Common Stock BFH | 75.81 | +1.96% |
If you’ve ever watched Bread Financial Holdings stock and wondered, “Is now the right time to buy, hold, or just move on?” you’re definitely not alone. Investors have had front-row seats to a stock that knows how to keep things interesting. Over the past year, Bread Financial has clocked an impressive 33.3% return, with long-term holders enjoying an 86.3% gain over five years. However, even in a market that never stands still, short-term swings can throw investors for a loop. The stock did slip 4.6% in the last week, only to show resilience with a 5.8% climb across the past month.
These price moves haven’t happened in a vacuum. Shifts in the financial sector’s risk appetite, changes in consumer credit markets, and evolving investor sentiment around digital banking platforms have all played their role. It’s no secret that Bread Financial has become a talking point as investors debate whether the recent growth is sustainable or simply reflects a new risk perception.
So, what does the value picture look like right now? On our scorecard, Bread Financial lands a value score of 4 out of 6. That is a tick for undervaluation across most checks we run, though not a clean sweep. These numbers beg the question: are investors underrating the upside here, or is the market pricing in risks that aren’t so obvious at first glance?
In the next sections, we’ll break down the specifics of how Bread Financial fares under several classic valuation methods, and we’ll also share one approach that could give you an even clearer edge when judging value.
Why Bread Financial Holdings is lagging behind its peersThe Excess Returns model evaluates how much value a company creates above what shareholders require as compensation for their investment. It focuses on return on equity, the cost of equity, and the company’s ability to sustain strong earnings compared to sector expectations.
For Bread Financial Holdings, the average return on equity stands at 11.90 percent, while the cost of equity per share is $8.19. The firm's book value is $67.94 per share, with a stable book value estimated at $72.08 per share based on analyst projections. Stable earnings per share are forecast at $8.58, and the annual excess return per share is $0.39, suggesting the company is earning more than the minimum demanded by its shareholders. These figures are sourced from weighted future estimates by a panel of analysts.
Based on this approach, the current estimated intrinsic value for Bread Financial Holdings is $76.82 per share. This is about 17.8 percent higher than recent trading prices, indicating an undervalued stock according to the Excess Returns framework.
Result: UNDERVALUED
Head to the Valuation section of our Company Report for more details on how we arrive at this Fair Value for Bread Financial Holdings.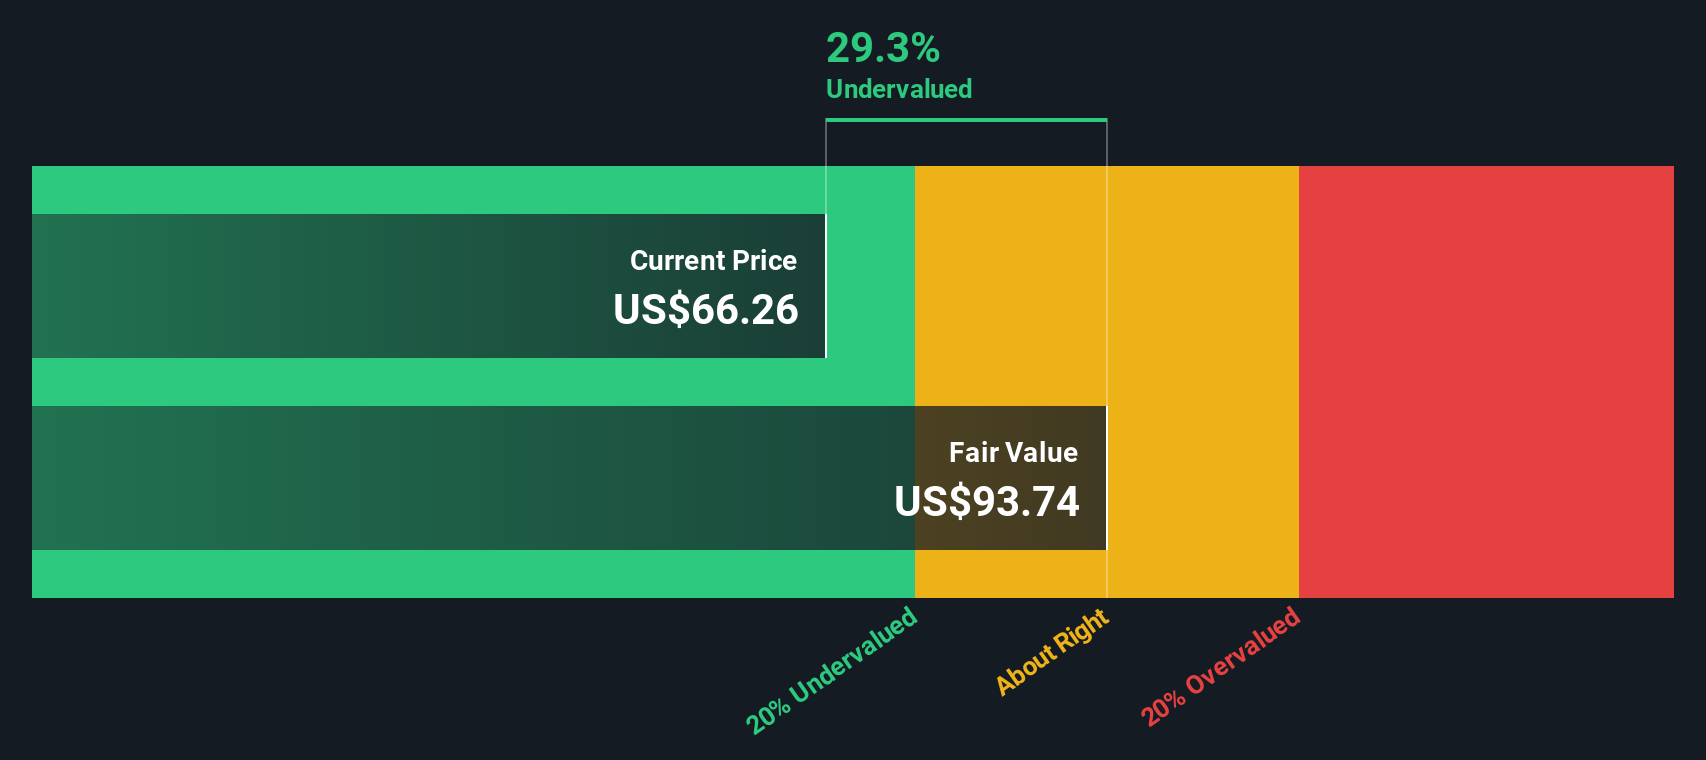
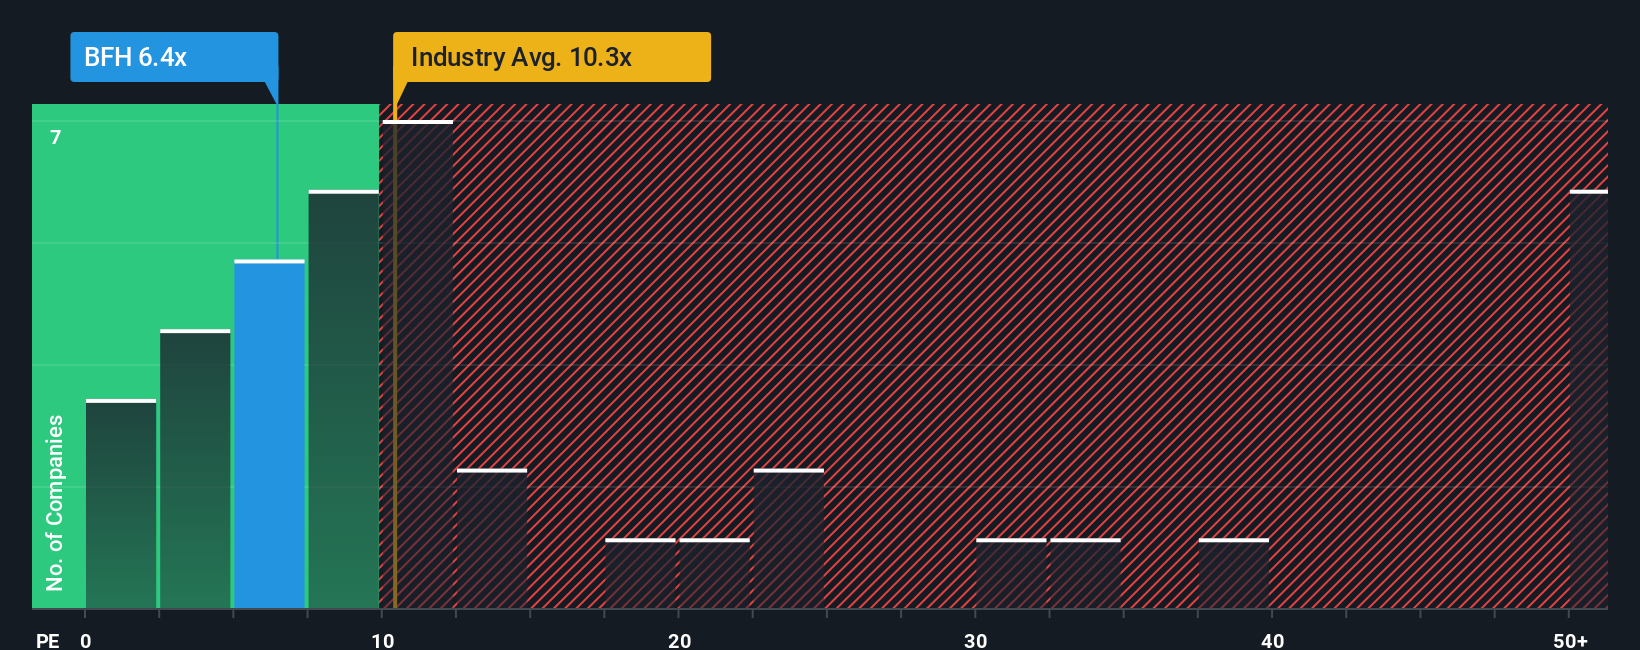
For profitable companies like Bread Financial Holdings, the price-to-earnings (PE) ratio is a widely used valuation metric because it reveals how much investors are willing to pay for each dollar of earnings. A higher PE often signals optimism about future growth, while a lower PE may reflect market caution or perceived risks.
The company's current PE ratio stands at 10.16x. This is just below the Consumer Finance industry average PE of 10.58x, and well below its selected peer group average of 13.58x. These numbers suggest that Bread Financial may be modestly valued. However, looking at peers and the industry only tells part of the story, since what is considered “normal” or “fair” depends upon unique factors like the company’s projected growth, risk profile, and earnings quality.
This is where Simply Wall St’s proprietary “Fair Ratio” calculation comes into play. The Fair Ratio, calculated at 15.65x for Bread Financial, takes into consideration not just industry and peer data, but also company-specific factors such as earnings growth outlook, risk, profit margins, and market capitalization. Unlike basic peer or industry comparisons, this approach provides a more accurate picture of what is reasonable for this business at the moment.
Comparing the Fair Ratio of 15.65x with the company’s actual PE of 10.16x shows that Bread Financial trades well below what would be deemed a fair valuation by these comprehensive standards. This points to an undervalued stock at present.
Result: UNDERVALUED
Earlier we mentioned that there is an even better way to understand valuation. Let's introduce you to Narratives. A Narrative is a simple yet powerful tool that lets you go beyond the numbers by attaching your story or perspective to Bread Financial Holdings, including your estimates of fair value and future business performance such as revenue, earnings, and margins.
Narratives bridge the gap between the company's story, your financial forecasts, and the resulting fair value. This approach can make investment decisions much more intuitive. Available to everyone on the Simply Wall St Community page, Narratives are easy to use and offer a dynamic view of each stock that millions of investors rely on.
By comparing your Narrative’s fair value with the company’s current share price, you can quickly see whether you believe it is time to buy, hold, or sell based on your own research and assumptions. The best part is that Narratives are automatically updated whenever significant news or earnings data is released, keeping your investment thesis relevant.
This article by Simply Wall St is general in nature. We provide commentary based on historical data and analyst forecasts only using an unbiased methodology and our articles are not intended to be financial advice. It does not constitute a recommendation to buy or sell any stock, and does not take account of your objectives, or your financial situation. We aim to bring you long-term focused analysis driven by fundamental data. Note that our analysis may not factor in the latest price-sensitive company announcements or qualitative material. Simply Wall St has no position in any stocks mentioned.
