With 88% ownership of the shares, Kemper Corporation (NYSE:KMPR) is heavily dominated by institutional owners
Kemper Corp KMPR | 31.78 31.78 | +1.53% 0.00% Post |
Key Insights
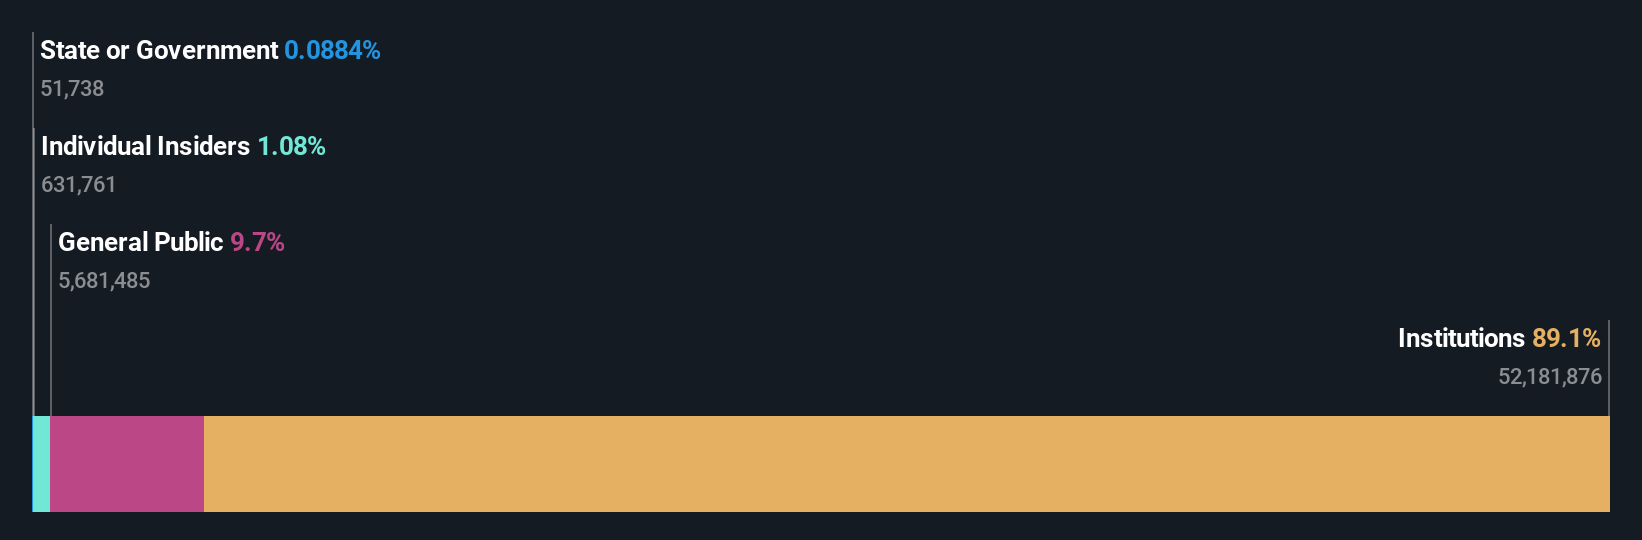
- Institutions' substantial holdings in Kemper implies that they have significant influence over the company's share price
- The top 11 shareholders own 51% of the company
If you want to know who really controls Kemper Corporation (NYSE:KMPR), then you'll have to look at the makeup of its share registry. With 88% stake, institutions possess the maximum shares in the company. Put another way, the group faces the maximum upside potential (or downside risk).
Since institutional have access to huge amounts of capital, their market moves tend to receive a lot of scrutiny by retail or individual investors. Therefore, a good portion of institutional money invested in the company is usually a huge vote of confidence on its future.
Let's take a closer look to see what the different types of shareholders can tell us about Kemper.
What Does The Institutional Ownership Tell Us About Kemper?
Institutional investors commonly compare their own returns to the returns of a commonly followed index. So they generally do consider buying larger companies that are included in the relevant benchmark index.
Kemper already has institutions on the share registry. Indeed, they own a respectable stake in the company. This suggests some credibility amongst professional investors. But we can't rely on that fact alone since institutions make bad investments sometimes, just like everyone does. If multiple institutions change their view on a stock at the same time, you could see the share price drop fast. It's therefore worth looking at Kemper's earnings history below. Of course, the future is what really matters.

Investors should note that institutions actually own more than half the company, so they can collectively wield significant power. We note that hedge funds don't have a meaningful investment in Kemper. Our data shows that The Vanguard Group, Inc. is the largest shareholder with 10% of shares outstanding. BlackRock, Inc. is the second largest shareholder owning 9.3% of common stock, and Fuller & Thaler Asset Management, Inc. holds about 6.5% of the company stock.
A closer look at our ownership figures suggests that the top 11 shareholders have a combined ownership of 51% implying that no single shareholder has a majority.
Researching institutional ownership is a good way to gauge and filter a stock's expected performance. The same can be achieved by studying analyst sentiments. Quite a few analysts cover the stock, so you could look into forecast growth quite easily.
Insider Ownership Of Kemper
The definition of an insider can differ slightly between different countries, but members of the board of directors always count. The company management answer to the board and the latter should represent the interests of shareholders. Notably, sometimes top-level managers are on the board themselves.
I generally consider insider ownership to be a good thing. However, on some occasions it makes it more difficult for other shareholders to hold the board accountable for decisions.
Shareholders would probably be interested to learn that insiders own shares in Kemper Corporation. It is a pretty big company, so it is generally a positive to see some potentially meaningful alignment. In this case, they own around US$25m worth of shares (at current prices). If you would like to explore the question of insider alignment, you can click here to see if insiders have been buying or selling.
General Public Ownership
The general public-- including retail investors -- own 11% stake in the company, and hence can't easily be ignored. While this size of ownership may not be enough to sway a policy decision in their favour, they can still make a collective impact on company policies.
Next Steps:
While it is well worth considering the different groups that own a company, there are other factors that are even more important.
Many find it useful to take an in depth look at how a company has performed in the past. You can access this detailed graph of past earnings, revenue and cash flow.
If you would prefer discover what analysts are predicting in terms of future growth, do not miss this free report on analyst forecasts.
NB: Figures in this article are calculated using data from the last twelve months, which refer to the 12-month period ending on the last date of the month the financial statement is dated. This may not be consistent with full year annual report figures.
This article by Simply Wall St is general in nature. We provide commentary based on historical data and analyst forecasts only using an unbiased methodology and our articles are not intended to be financial advice. It does not constitute a recommendation to buy or sell any stock, and does not take account of your objectives, or your financial situation. We aim to bring you long-term focused analysis driven by fundamental data. Note that our analysis may not factor in the latest price-sensitive company announcements or qualitative material. Simply Wall St has no position in any stocks mentioned.