Woodward (WWD) has opened its 2026 financial year with Q1 revenue of US$996.5 million and basic EPS of US$2.23, alongside trailing twelve month revenue of US$3.8 billion and EPS of US$8.18 that tie into reported earnings growth of 32.1% over the past year. The company has seen revenue move from US$772.7 million and EPS of US$1.47 in Q1 2025 to US$996.5 million and EPS of US$2.23 in Q1 2026, while trailing net margin has shifted from 11.2% to 12.9%, setting up a results season in which investors are likely to focus on how much of that margin profile can be sustained.
See our full analysis for Woodward.
With the latest numbers on the table, the next step is to line them up against the widely followed narratives around Woodward’s growth, profitability and risks to see which stories hold up and which ones get questioned.
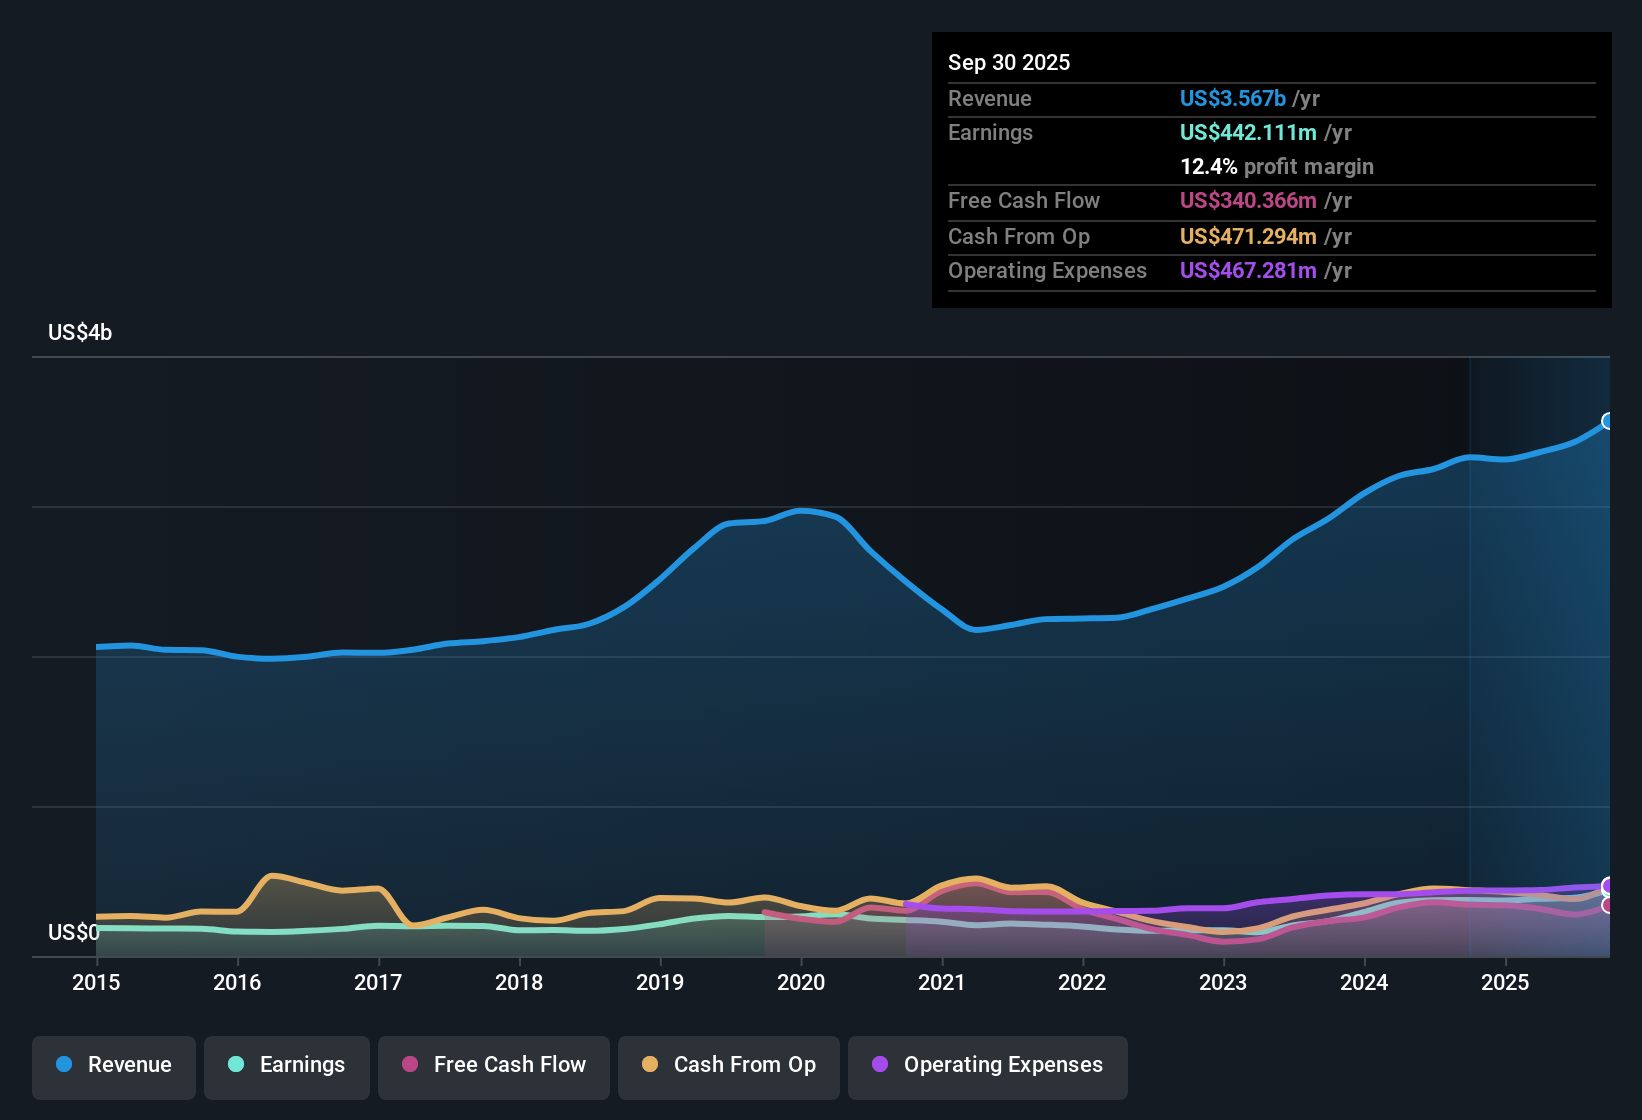
NasdaqGS:WWD Earnings & Revenue History as at Feb 2026
TTM net income reaches US$488.7 million
Over the last 12 months, Woodward earned US$488.7 million in net income on US$3.8b of revenue, compared with US$442.1 million on US$3.6b of revenue in the prior trailing period.
Supporters with a bullish tilt often point to this kind of earnings profile as backing a quality story, yet the data invites a closer look:
Trailing EPS over the last year sits at US$8.18, above the US$7.42 figure from the prior trailing period, which aligns with the 32.1% earnings growth cited over the past year.
At the same time, Q1 2026 net income of US$133.7 million is close to the US$137.6 million reported in Q4 2025. This suggests the most recent step up is steadier rather than explosive, even with the strong year over year growth headline.
To see how this earnings run fits into the bigger story on growth, valuation, and risks, check the balanced market take on Woodward.
📊 Read the full Woodward Consensus Narrative.
Margins at 12.9% reshape the profit story
The trailing net margin of 12.9% compares with 11.2% a year earlier, paired with trailing revenue of US$3.8b and net income of US$488.7 million.
For those taking a bullish angle, one point of interest is how these margins interact with growth forecasts:
Earnings are described as high quality and are forecast to grow about 11.75% per year, while revenue growth is forecast at 8.1% per year, which sits below the cited 10.1% for the broader US market.
This mix, with higher margins on one side and a slower revenue growth forecast on the other, gives bulls support on profitability but also sets a higher bar for how long that margin level can be maintained.
P/E of 45.6x and DCF gap frame valuation risks
Woodward trades on a P/E of 45.6x versus a peer average of 48.6x and a US Aerospace & Defense average of 40.3x, while the current share price of US$371.17 sits above the DCF fair value of about US$308.09.
Critics taking a more bearish tone often focus on this valuation tension, and the current numbers give them clear talking points:
The stock carries a premium to the industry P/E at 40.3x, even though it is below the peer group average, which means the market is paying more than the wider industry multiple for Woodward’s earnings.
The share price also stands above the DCF fair value estimate of roughly US$308.09, so investors who lean cautious may see limited room for error if earnings growth slows from the trailing 32.1% pace toward the 11.75% forecast.
Next Steps
Don't just look at this quarter; the real story is in the long-term trend. We've done an in-depth analysis on Woodward's growth and its valuation to see if today's price is a bargain. Add the company to your watchlist or portfolio now so you don't miss the next big move.
See What Else Is Out There
For all the earnings strength, Woodward’s current P/E of 45.6x and share price above an estimated DCF value highlight clear valuation pressure for cautious investors.
If paying up for that kind of premium makes you uneasy, use our these 873 undervalued stocks based on cash flows to focus on companies where price lines up more tightly with underlying cash flows and earnings power.
This article by Simply Wall St is general in nature. We provide commentary based on historical data and analyst forecasts only using an unbiased methodology and our articles are not intended to be financial advice. It does not constitute a recommendation to buy or sell any stock, and does not take account of your objectives, or your financial situation. We aim to bring you long-term focused analysis driven by fundamental data. Note that our analysis may not factor in the latest price-sensitive company announcements or qualitative material. Simply Wall St has no position in any stocks mentioned.