
Please use a PC Browser to access Register-Tadawul
Get It
Workday (WDAY) Valuation Check As Aneel Bhusri Returns To The CEO Role
Workday, Inc. Class A WDAY | 137.81 | -1.58% |
Workday (WDAY) is back in the spotlight after co founder and executive chair Aneel Bhusri returned as CEO, replacing Carl Eschenbach. The leadership shift comes as investors focus on artificial intelligence and growth.
The leadership change and recent AI announcements have arrived during a weak patch for the stock, with a 30 day share price return of 25.55% decline and a 1 year total shareholder return of 44.03% decline. This suggests negative momentum as the market reassesses growth prospects and execution risks.
If you are thinking about how AI stories are playing out across the market, it could be worth looking at 57 profitable AI stocks that aren't just burning cash as another way to find ideas tied to this theme.
With Workday now trading well below recent highs and flagged as at a 55% intrinsic discount, the key question is whether sentiment has swung too far or if the current price already reflects slower growth ahead.
Workday's last close at $144.42 sits well below the $253.14 fair value outlined in the most followed narrative, setting up a clear valuation gap for investors to weigh.
This narrative is brief and simply stands on the shoulders of the recent aggregate analysts review (Dec 2024). Put simply, if revenue grows at <15% pa and margins fall to <20% average over next 3 years, that implies a pretty consistent growth rate that contradicts the high PE ratio for this stock. A reasonable investor is not going to pay 50+ PE (for 2% returns on current price) for a company with proven growth <15%. Further, with the risk factors in play especially AI, the discount rate used by any investor should be higher to justify the returns. Thus, even allowing for revenue growth at 15% and margins at 20%, with discount rate holding at 7.08%, if PE acceptance falls to 30x then indicated fair value is $253.14. That still implies higher future growth than would have been demonstrated for 5-7 years up that point.
Curious how revenue growth, margin assumptions and a higher discount rate can still land on a fair value far above today’s price? According to Chester, the real twist is how the future earnings multiple fits into that puzzle. If you want the full picture behind that gap, the narrative lays out the moving parts without sugar coating them.
Result: Fair Value of $253.14 (UNDERVALUED)
However, there are clear risks here, including Workday’s recent share price declines and the possibility that AI related competition or adoption trends could pressure those assumptions.
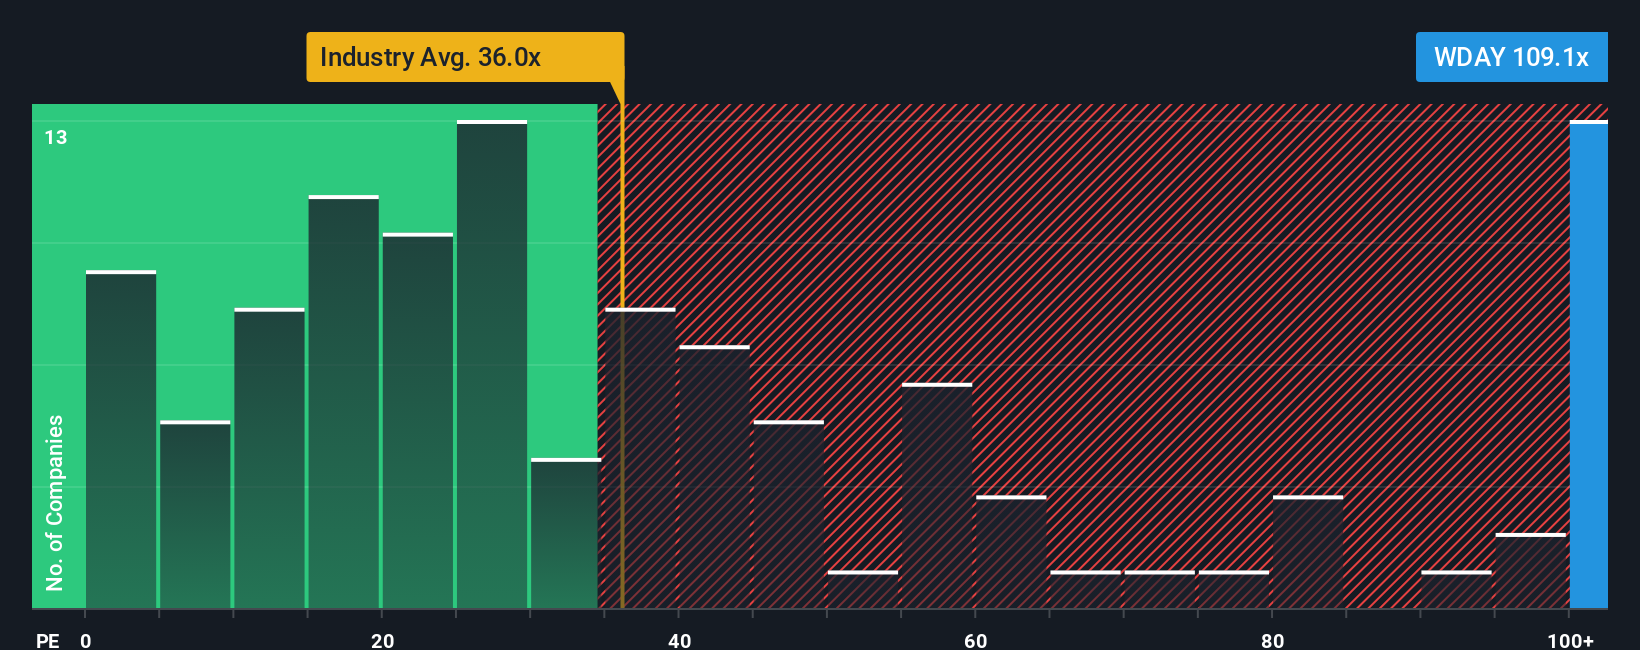
While the popular narrative points to a $253.14 fair value, the current P/E of 59.2x tells a different story. That is higher than both the US Software industry at 26.7x and peers at 47.9x, and above a fair ratio of 40.7x, which could mean valuation risk if expectations slip.
If you are not sold on these views, or prefer to lean on your own work, you can pull the numbers, stress test the assumptions and Do it your way in under three minutes.
A great starting point for your Workday research is our analysis highlighting 2 key rewards and 2 important warning signs that could impact your investment decision.
If you are serious about building a stronger watchlist, do not stop at one stock. Use targeted screens to uncover opportunities that match your style.
This article by Simply Wall St is general in nature. We provide commentary based on historical data and analyst forecasts only using an unbiased methodology and our articles are not intended to be financial advice. It does not constitute a recommendation to buy or sell any stock, and does not take account of your objectives, or your financial situation. We aim to bring you long-term focused analysis driven by fundamental data. Note that our analysis may not factor in the latest price-sensitive company announcements or qualitative material. Simply Wall St has no position in any stocks mentioned.
