Zions Bancorporation National Association (ZION) closed out FY 2025 with Q4 revenue of US$885 million and basic EPS of US$1.78, underpinned by net income of US$262 million as the bank reported its latest set of results. The company has seen revenue move from US$779 million and EPS of US$1.34 in Q4 FY 2024 to US$885 million and EPS of US$1.78 in Q4 FY 2025, setting up a story where investors are weighing higher earnings against how sustainable those margins look from here.
See our full analysis for Zions Bancorporation National Association.
With the headline numbers on the table, the next step is to see how this earnings print lines up with the widely held narratives around Zions, and where the recent margin profile supports or challenges those views.
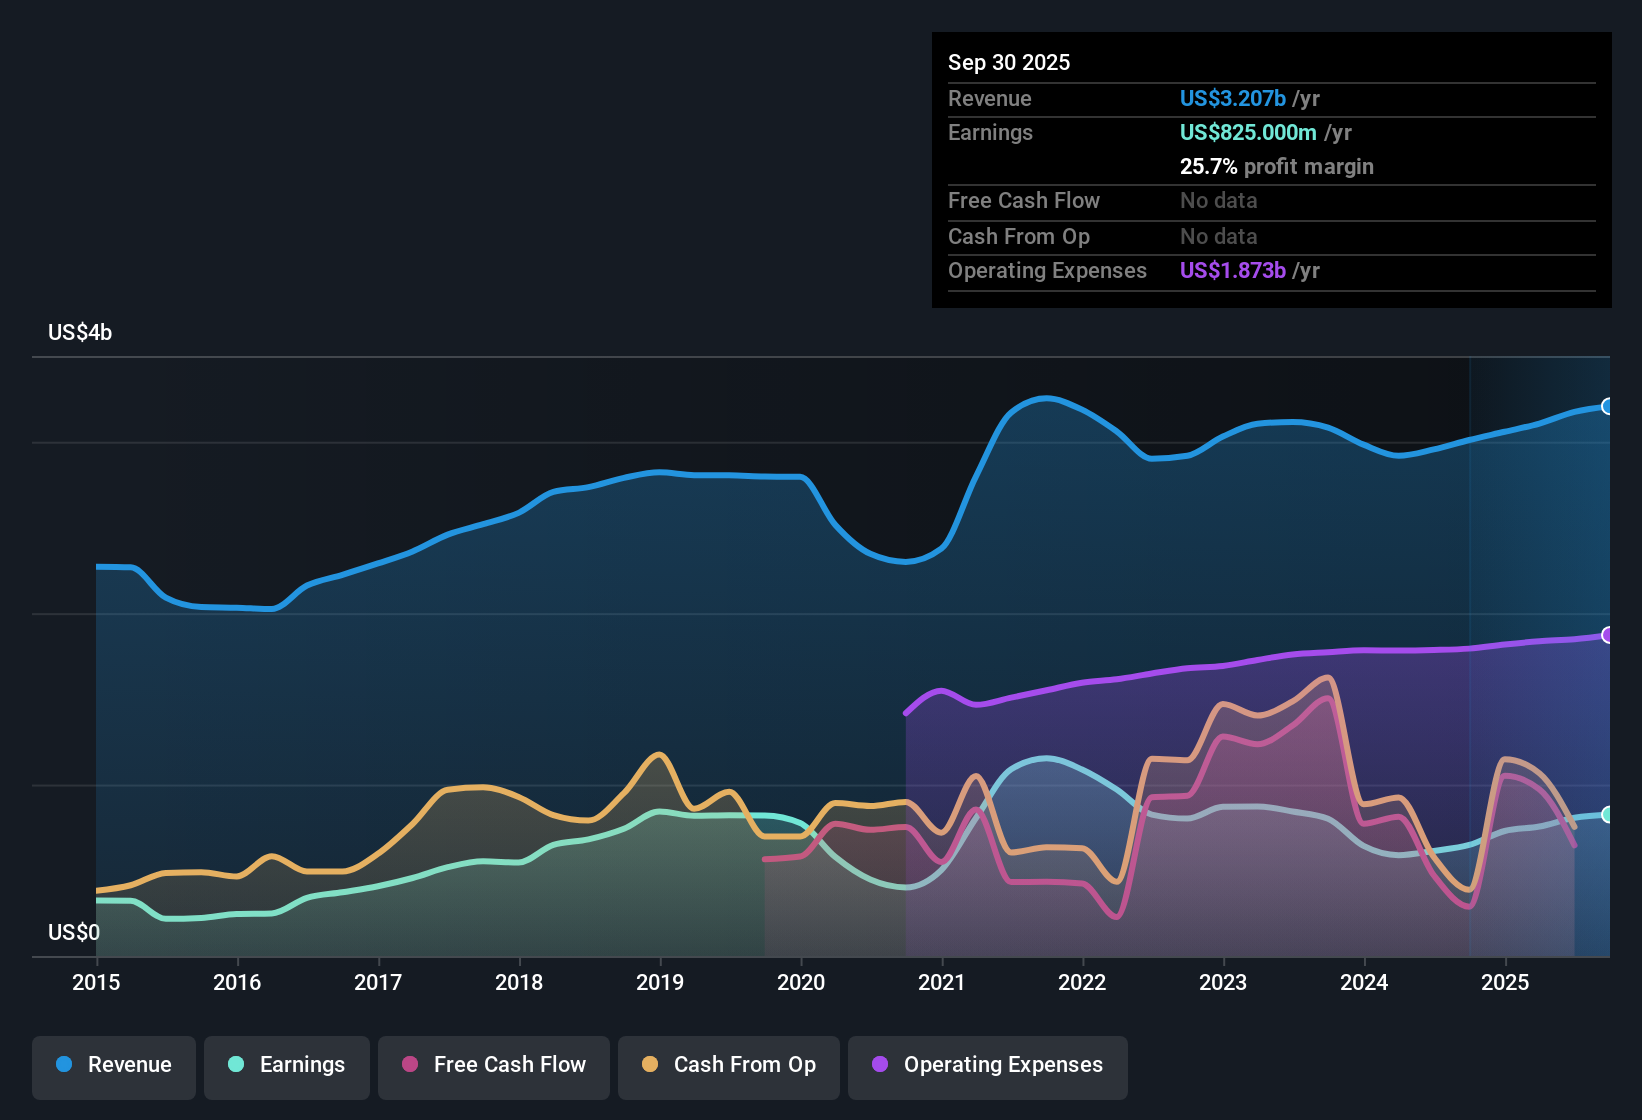
NasdaqGS:ZION Earnings & Revenue History as at Jan 2026
3.21% net interest margin supports earnings lift
On a trailing 12 month basis, net interest margin sits at 3.21%, with quarterly levels in FY 2025 ranging from 3.10% to 3.31%, alongside TTM net income of US$895 million and basic EPS of US$6.08.
What is surprising for a more cautious view is that higher margins are lining up with stronger earnings, even though multi year EPS trends have been softer. This heavily supports a more bullish angle that the core banking engine is still doing its job.
Trailing net profit margin is 27%, compared with 23.8% a year earlier, while FY 2025 quarterly EPS moved between US$1.13 and US$1.78, giving bulls concrete profitability metrics to point to.
Earnings per share grew 22.8% over the last year despite a 4.3% per year decline over five years, so recent numbers back the optimistic view that the bank is currently converting revenue into profit more efficiently than that longer term trend suggests.
Over the last year, these margin and EPS figures have some investors asking whether the recent profitability profile deserves more attention than the weaker five year trend.
📊 Read the full Zions Bancorporation National Association Consensus Narrative.
Loan book at US$60.9b with mixed credit signals
Total loans reached US$60.9b at the end of Q4 FY 2025, while non performing loans were US$315 million, compared with US$363 million at the end of Q3 FY 2024 on a trailing basis.
Critics highlight that regional banks can be vulnerable to credit cycles, and here the data gives a mixed picture that challenges an overly bearish stance while still keeping credit quality in focus.
Across FY 2025, quarterly non performing loans ranged from US$305 million to US$319 million against a loan book just under or slightly above US$60b, which suggests problem assets exist but are a relatively small slice of total loans based on these figures.
At the same time, revenue is forecast to grow about 4% per year and earnings about 2.6% per year versus higher market forecasts. A cautious view still finds support in the idea that slower expected growth may limit how much benefit investors might see from current credit metrics.
P/E of 10.2x and DCF gap catch value focused eyes
The shares trade at US$61.58 with a P/E of 10.2x, below the US Banks industry average of 11.8x and a peer average of 14.2x, while the stated DCF fair value is US$127.65 and the trailing dividend yield is 2.92%.
What stands out for investors who lean bullish is how these valuation and income metrics line up with the recent profit improvement, although the more cautious growth outlook gives bears talking points too.
The stock price sits about 51.8% below the provided DCF fair value, and net profit margin at 27% on a trailing basis means current profitability is being valued at a discount relative to both industry and peers based on the P/E comparison.
On the other hand, forecasts for 4% annual revenue growth and 2.6% annual earnings growth, both below the broader US market expectations, give a bearish argument that the discount could reflect slower expected expansion rather than a simple mispricing.
Next Steps
Don't just look at this quarter; the real story is in the long-term trend. We've done an in-depth analysis on Zions Bancorporation National Association's growth and its valuation to see if today's price is a bargain. Add the company to your watchlist or portfolio now so you don't miss the next big move.
See What Else Is Out There
While margins and recent EPS look stronger, the shares are priced with slower forecast revenue and earnings growth than the broader US market.
If that slower outlook makes you hesitate, shift your focus to stable growth stocks screener (2164 results) to quickly narrow your search to companies with more consistent expansion and potentially steadier return potential.
This article by Simply Wall St is general in nature. We provide commentary based on historical data and analyst forecasts only using an unbiased methodology and our articles are not intended to be financial advice. It does not constitute a recommendation to buy or sell any stock, and does not take account of your objectives, or your financial situation. We aim to bring you long-term focused analysis driven by fundamental data. Note that our analysis may not factor in the latest price-sensitive company announcements or qualitative material. Simply Wall St has no position in any stocks mentioned.