
Please use a PC Browser to access Register-Tadawul
Get It
A Look At Best Buy (BBY) Valuation As Sales Trends Show Signs Of Recovery
Best Buy Co.,Inc. BBY | 65.74 65.94 | -1.51% +0.31% Pre |
Best Buy (BBY) is drawing fresh attention after recent commentary highlighted improving sales trends following a soft early December, along with renewed discussion of how its physical stores and services compare with online rivals.
At a share price of $66.56, Best Buy has seen a 1 day share price return of 1.11%. However, its 30 day and 90 day share price returns of 6.65% and 19.25% declines, alongside a 1 year total shareholder return decline of 16.42%, point to fading momentum despite recent commentary around improving sales trends and its role as a steady electronics retailer.
If this mix of pressure and resilience has your attention, it could be a good moment to broaden your watchlist with fast growing stocks with high insider ownership.
With Best Buy trading at $66.56, sitting at what is described as a discount to analyst targets and intrinsic value estimates, you have to ask: is this a contrarian entry point, or is the market already pricing in any future recovery?
With Best Buy last closing at $66.56 and trading on a P/E of 21.6x, the stock screens as slightly expensive versus the US Specialty Retail average but roughly aligned with its own estimated fair P/E.
The P/E ratio compares the share price to earnings per share, so a higher P/E often reflects the market paying up today for expected future earnings. For a mature electronics retailer, that matters because earnings trends, one off items and future profit expectations can all skew what looks cheap or expensive at first glance.
Here, Best Buy's P/E of 21.6x sits above the US Specialty Retail industry average of 20.1x, suggesting investors are paying a premium compared to the broader peer group. However, that same 21.6x is below the peer average of 33x and close to the estimated fair P/E of 22.6x, which points to a level the market could reasonably move toward if those earnings expectations hold.
Result: Price-to-Earnings of 21.6x (ABOUT RIGHT)
However, you still have to weigh risks such as ongoing share price pressure, with 1 year and 5 year total returns negative, and competition from online and offline retailers.
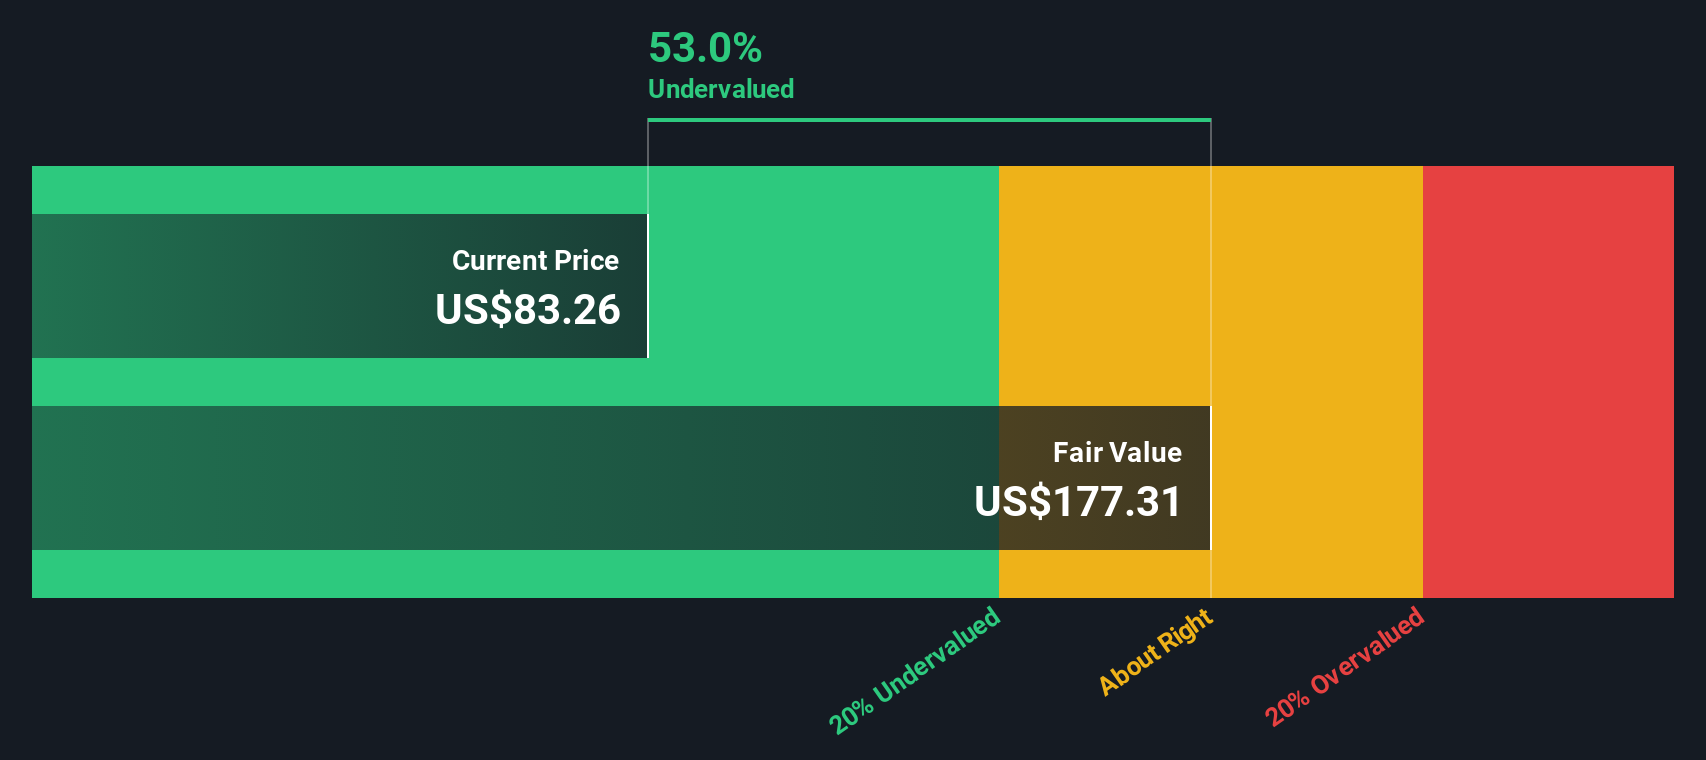
While the P/E of 21.6x suggests Best Buy is roughly in line with its fair ratio of 22.6x, our DCF model presents a different perspective, with an estimated future cash flow value of $145.93 per share compared to the current $66.56. That gap raises a simple question: is the market underestimating Best Buy's cash generation potential?
Simply Wall St performs a discounted cash flow (DCF) on every stock in the world every day (check out Best Buy for example). We show the entire calculation in full. You can track the result in your watchlist or portfolio and be alerted when this changes, or use our stock screener to discover 881 undervalued stocks based on their cash flows. If you save a screener we even alert you when new companies match - so you never miss a potential opportunity.
If you see the numbers differently or prefer to trust your own work, you can build a fresh view in just a few minutes with Do it your way.
A great starting point for your Best Buy research is our analysis highlighting 3 key rewards and 3 important warning signs that could impact your investment decision.
If Best Buy is on your radar, do not stop there. The wider your opportunity set, the better your chances of finding ideas that truly fit your goals.
This article by Simply Wall St is general in nature. We provide commentary based on historical data and analyst forecasts only using an unbiased methodology and our articles are not intended to be financial advice. It does not constitute a recommendation to buy or sell any stock, and does not take account of your objectives, or your financial situation. We aim to bring you long-term focused analysis driven by fundamental data. Note that our analysis may not factor in the latest price-sensitive company announcements or qualitative material. Simply Wall St has no position in any stocks mentioned.
