A Look At CBL & Associates Properties (CBL) Valuation After City Support For Northgate Mall Redevelopment
CBL & Associates Properties, Inc. CBL | 40.99 40.99 | -0.05% 0.00% Post |
City-backed Northgate Mall overhaul puts CBL & Associates Properties (CBL) in focus
The Chattanooga City Council’s resolution supporting CBL’s Northgate Mall overhaul, including a $15 million infrastructure plan and community input requirements, has put fresh attention on how this project could influence the REIT’s broader portfolio.
For investors watching the bigger picture, CBL’s recent Northgate headlines come alongside a 28.26% 90 day share price return and a 37.85% 1 year total shareholder return. This suggests momentum has been building around the stock.
If this kind of retail real estate story has your attention, it can be useful to see what else is moving and compare fundamentals across the market.
If you are widening your watchlist beyond mall owners, now could be a good time to check out fast growing stocks with high insider ownership as a way to spot other interesting ideas.
With CBL shares posting a 28.26% 90 day return and trading about 21% below one analyst price target, the real question is whether you are looking at underappreciated value or a stock already pricing in future growth.
Price-to-Earnings of 9.3x: Is it justified?
On a P/E of 9.3x at a last close of US$37.26, CBL & Associates Properties screens as inexpensive compared to both its own fair ratio and the wider Retail REITs group.
The P/E ratio compares the current share price with earnings per share. It gives a quick sense of how much investors are paying for each dollar of profit. For a REIT like CBL, a lower P/E can signal that the market is applying a discount to its earnings stream compared with peers.
Here, CBL is flagged as good value versus the US Retail REITs industry average P/E of 27.4x and a peer average of 54x. It is also trading below an estimated fair P/E of 14.4x. The market could move towards this level if sentiment and earnings expectations line up more closely with this fair ratio view.
Result: Price-to-Earnings of 9.3x (UNDERVALUED)
However, you still need to weigh risks such as annual net income declining by 66% and any setbacks on Northgate or other redevelopment plans.
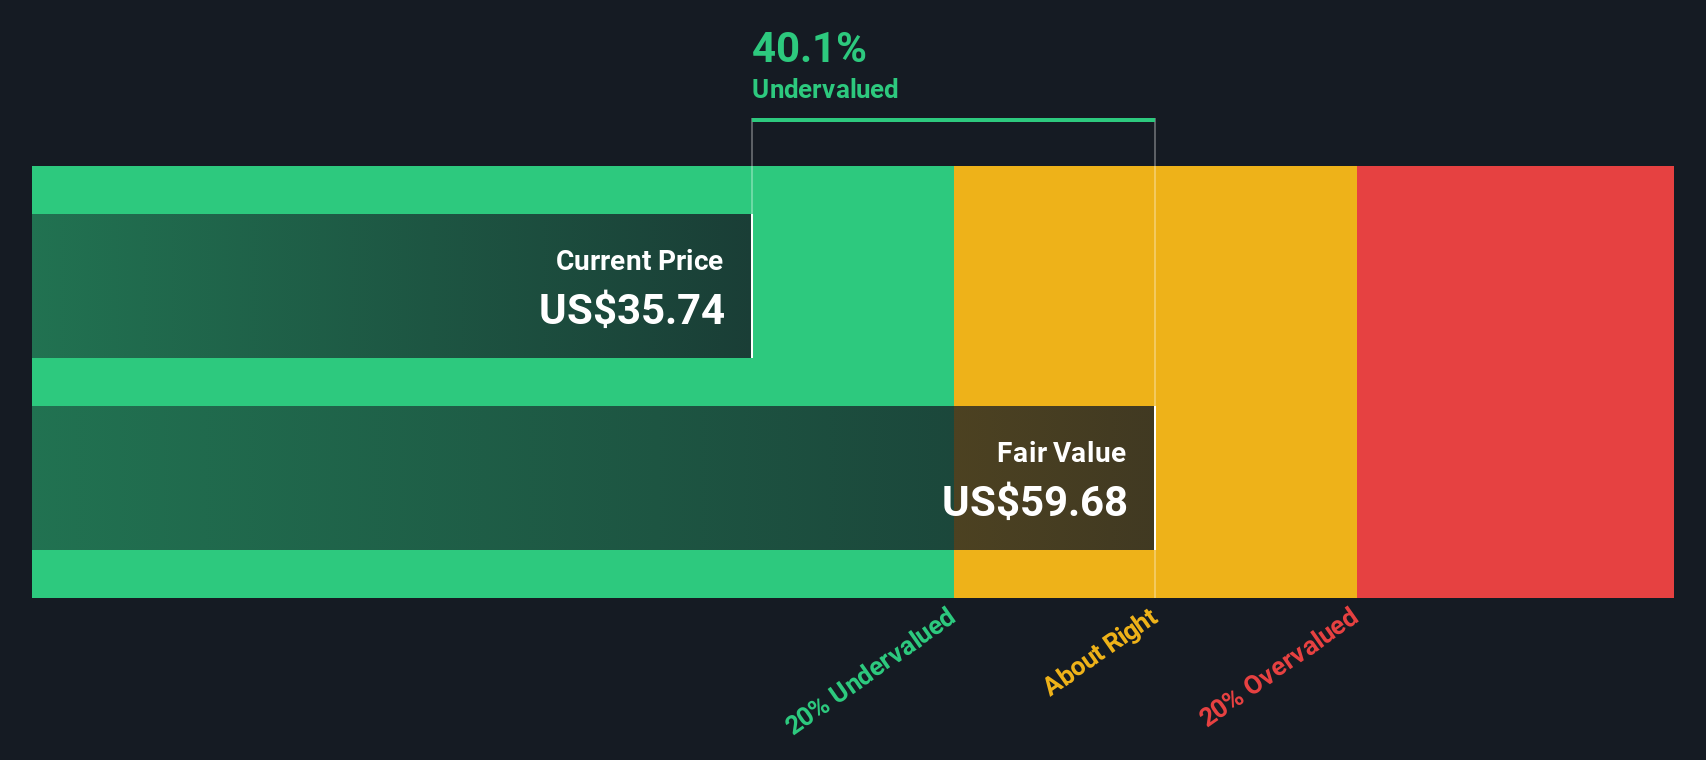
Another View: Our DCF model points even higher
Our DCF model indicates an estimated fair value of about US$60.80 per share, compared with the current US$37.26. That difference suggests the market could be pricing in a lot of risk already. The key question is whether you think those worries are overdone.
Simply Wall St performs a discounted cash flow (DCF) on every stock in the world every day (check out CBL & Associates Properties for example). We show the entire calculation in full. You can track the result in your watchlist or portfolio and be alerted when this changes, or use our stock screener to discover 884 undervalued stocks based on their cash flows. If you save a screener we even alert you when new companies match - so you never miss a potential opportunity.
Build Your Own CBL & Associates Properties Narrative
If you look at this and reach a different conclusion, or simply prefer to test the assumptions yourself, you can build a custom view in minutes, starting with Do it your way.
A great starting point for your CBL & Associates Properties research is our analysis highlighting 3 key rewards and 4 important warning signs that could impact your investment decision.
Looking for more investment ideas?
If CBL has sharpened your curiosity, do not stop here. Use the Simply Wall St Screener to size up other potential opportunities before they move without you.
- Spot early stage opportunities with clear financial filters by scanning these 3545 penny stocks with strong financials that pass your risk and quality criteria.
- Ride major tech shifts with focus by zeroing in on these 26 AI penny stocks that match your growth and business model preferences.
- Prioritise price discipline by checking these 884 undervalued stocks based on cash flows that look attractively priced against their cash flow profiles.
This article by Simply Wall St is general in nature. We provide commentary based on historical data and analyst forecasts only using an unbiased methodology and our articles are not intended to be financial advice. It does not constitute a recommendation to buy or sell any stock, and does not take account of your objectives, or your financial situation. We aim to bring you long-term focused analysis driven by fundamental data. Note that our analysis may not factor in the latest price-sensitive company announcements or qualitative material. Simply Wall St has no position in any stocks mentioned.