
Please use a PC Browser to access Register-Tadawul
Get It
A Look At Grid Dynamics Holdings (GDYN) Valuation After New AWS Generative AI Collaboration
Grid Dynamics Holdings, Inc. Class A GDYN | 9.17 | -2.13% |
Grid Dynamics Holdings (GDYN) is back on investors’ radar after entering a multi-year collaboration with Amazon Web Services centered on generative AI solutions for enterprise clients, framed against fresh insider stock sales and equity plan changes.
The AWS collaboration arrives after a choppy period for shareholders, with a 25% 90 day share price return contrasted by a 53.17% decline in 1 year total shareholder return. Recent momentum is improving, but long term performance remains weak.
If this generative AI partnership has caught your attention, it could be a good moment to see what else is happening across high growth tech and AI stocks and compare potential opportunities.
With Grid Dynamics trading at a discount to analyst targets and its own intrinsic estimate, yet carrying a weak 1 year and multi year return record, you have to ask: is there real upside left here, or is the market already pricing in future growth?
With Grid Dynamics last closing at US$9.53 against a narrative fair value of US$12.50, the current pricing gap is driving a very specific upside story.
Ongoing investments in proprietary, reusable AI/ML solutions (like GAIN and agentic platforms) are unlocking higher efficiency and operating leverage. This strengthens Grid's ability to upsell, compete for enterprise-scale modernization deals, and grow revenue per employee, directly supporting future net margin and earnings expansion as fixed costs are leveraged across more engagements.
Want to see what is sitting behind that US$12.50 number? Revenue compounding, shifting margins, and a future earnings multiple that might surprise you all sit inside this narrative. Curious which assumptions really carry the valuation model and how sensitive that fair value is to small tweaks in growth and profitability?
Result: Fair Value of $12.50 (UNDERVALUED)
However, you still need to weigh up risks, such as shrinking profit margins in analyst forecasts and revenue pressure from AI automation tools reducing demand for traditional engineering work.
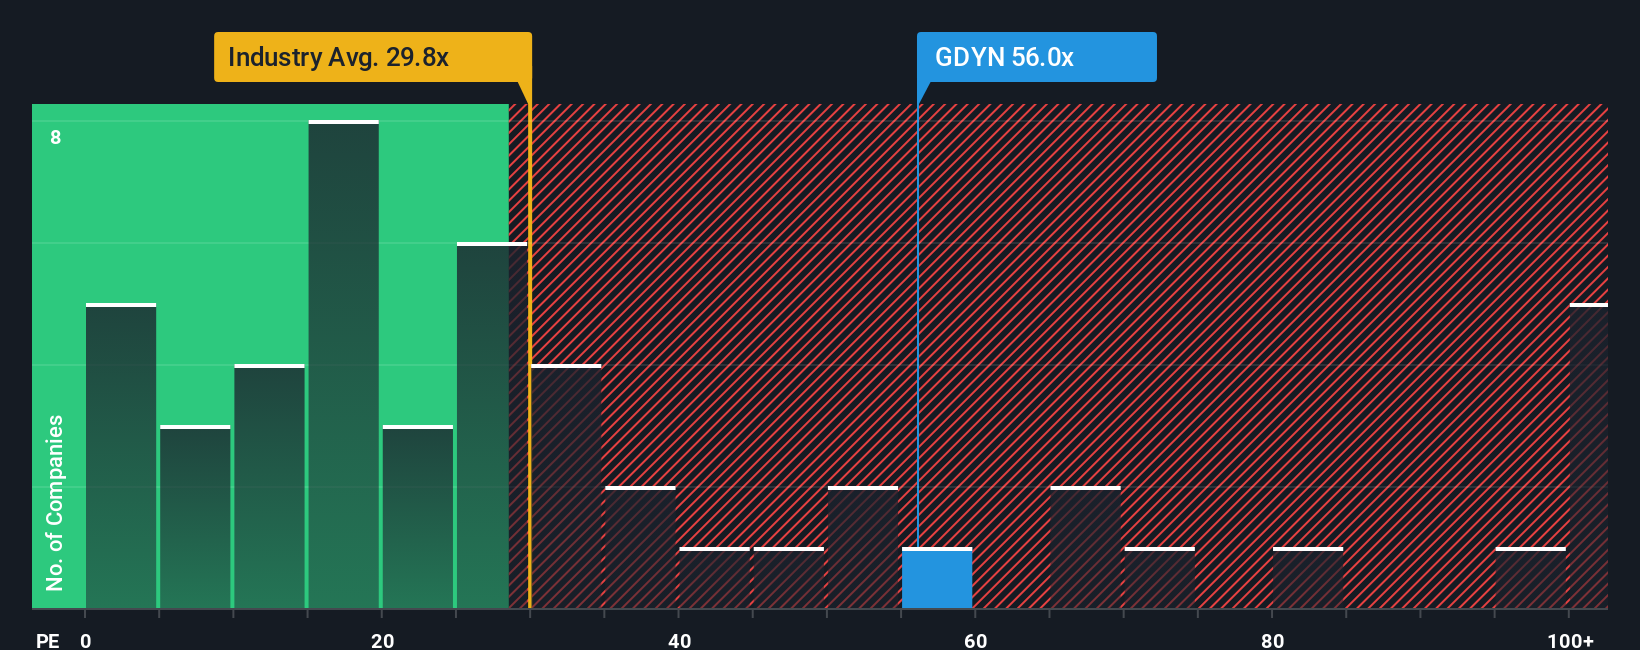
The fair value narrative points to opportunity, yet the current P/E of 58.2x tells a different story. That multiple is far higher than the US IT industry on 31.1x and the peer average on 27.4x. It also sits well above a 30.8x fair ratio that our work suggests the market could move toward over time.
In plain terms, the share price already reflects a lot of optimism compared with sector peers and that fair ratio, which introduces valuation risk if expectations cool. The question is whether you think Grid Dynamics can justify such a premium or if you would rather wait for a closer match to that fair ratio.
If you see the numbers differently or simply prefer to test your own assumptions, you can build a complete Grid Dynamics story in minutes with Do it your way.
A great starting point for your Grid Dynamics Holdings research is our analysis highlighting 4 key rewards and 1 important warning sign that could impact your investment decision.
If Grid Dynamics has you thinking more carefully about price and potential, do not stop here. Cast a wider net and pressure test your ideas across fresh opportunities.
This article by Simply Wall St is general in nature. We provide commentary based on historical data and analyst forecasts only using an unbiased methodology and our articles are not intended to be financial advice. It does not constitute a recommendation to buy or sell any stock, and does not take account of your objectives, or your financial situation. We aim to bring you long-term focused analysis driven by fundamental data. Note that our analysis may not factor in the latest price-sensitive company announcements or qualitative material. Simply Wall St has no position in any stocks mentioned.
