A Look At PJT Partners (PJT) Valuation After Strong Growth And Fresh UBS Coverage
PJT Partners, Inc. Class A PJT | 0.00 |
Why PJT Partners Stock Is Back on Investors’ Radar
PJT Partners (PJT) recently hit an all time high after reporting 23.3% revenue growth, beating earnings expectations, and attracting fresh UBS coverage with a Neutral rating focused on productivity from past investments.
The recent earnings beat and UBS coverage have arrived alongside firm share price momentum, with a 1 month share price return of 11.47% and a 1 year total shareholder return of 18.03%. The 3 year total shareholder return of about 15x suggests longer term holders have also seen strong gains.
If PJT’s move has you thinking about where else capital might be working hard, it could be a good moment to scan fast growing stocks with high insider ownership for other high conviction ideas.
With PJT now trading around its all time high and sitting slightly above the average analyst price target, the key question is whether the recent quality growth is still underappreciated or if the market is already pricing in more ahead.
Price-to-Earnings of 26.1x: Is It Justified?
At a last close of $191.23, PJT Partners is trading on a P/E of 26.1x, which screens as expensive against both its industry and closest peers.
The P/E multiple tells you how much investors are currently paying for each dollar of PJT's earnings, which matters a lot for advisory focused financial firms where earnings can be cyclical and fee driven.
In PJT's case, that 26.1x P/E sits slightly above the US Capital Markets industry average of 25.5x and well above the peer group average of 17.6x. This suggests the market is assigning PJT a premium relative to similar businesses rather than pricing it in line with the broader group.
Result: Price-to-Earnings of 26.1x (OVERVALUED)
However, there are clear risks, including PJT trading above its average analyst target, and earnings that depend heavily on transaction and restructuring activity remaining supportive.
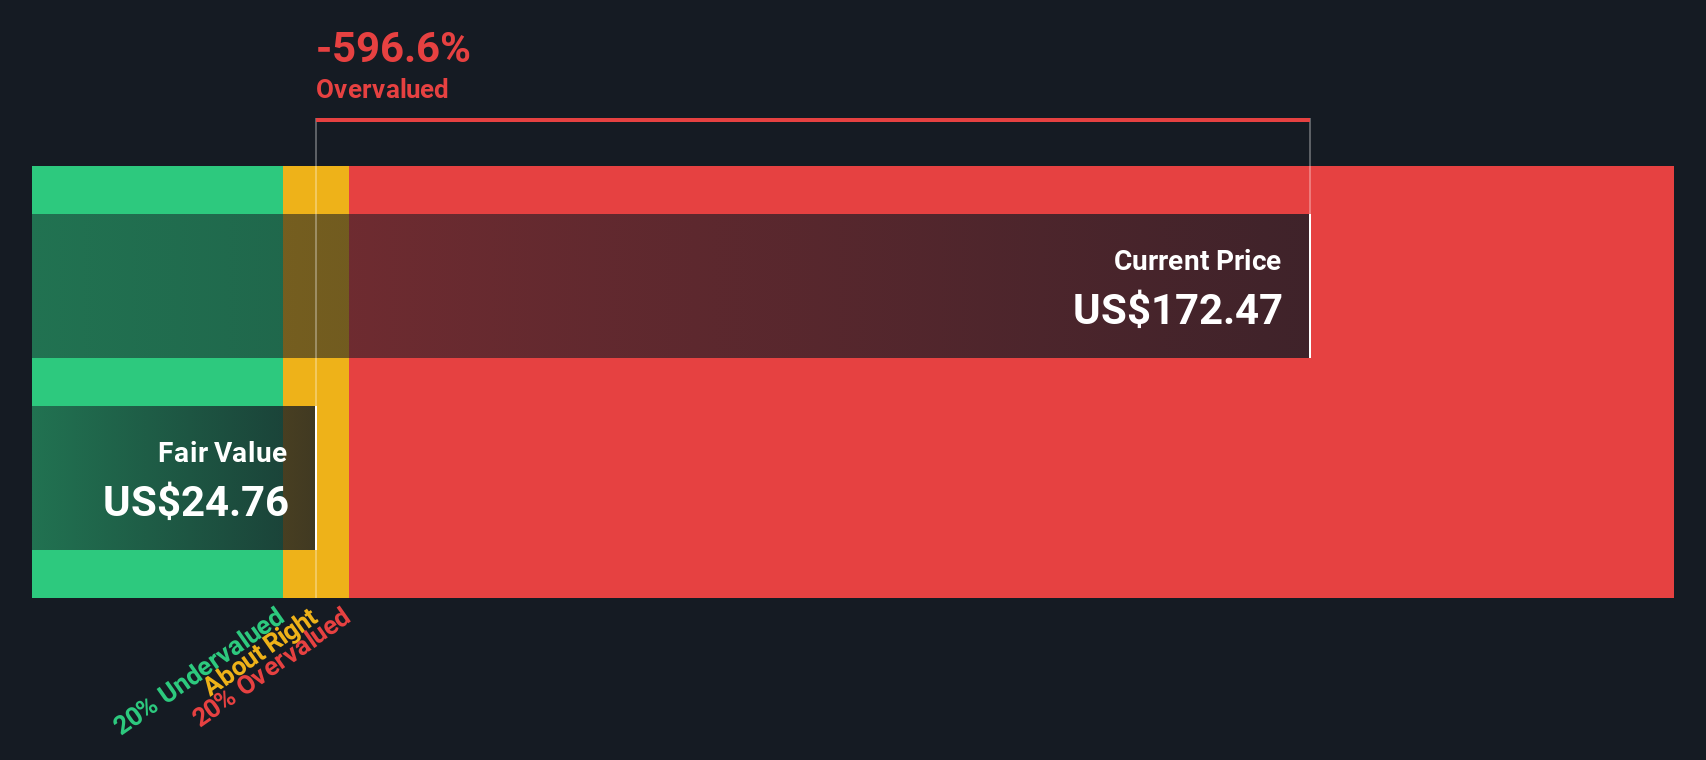
Another View: Our DCF Flags Clear Downside
The P/E of 26.1x suggests PJT is expensive, and our DCF model goes further, with a future cash flow value of about $93.09 per share versus the current $191.23. That indicates a substantial potential downside. This raises the question of whether the recent strength is more about momentum than fundamentals.
Simply Wall St performs a discounted cash flow (DCF) on every stock in the world every day (check out PJT Partners for example). We show the entire calculation in full. You can track the result in your watchlist or portfolio and be alerted when this changes, or use our stock screener to discover 876 undervalued stocks based on their cash flows. If you save a screener we even alert you when new companies match - so you never miss a potential opportunity.
Build Your Own PJT Partners Narrative
If you look at these numbers and reach a different conclusion, or prefer to test your own view against the data, you can build a full PJT story yourself in a few minutes with Do it your way.
A good starting point is our analysis highlighting 1 key reward investors are optimistic about regarding PJT Partners.
Ready to Find Your Next Idea?
If PJT has caught your attention, do not stop here. Use the Simply Wall St Screener to quickly surface other ideas that might fit your playbook.
- Spot potential value by scanning these 876 undervalued stocks based on cash flows that our models flag as trading below their estimated cash flow based worth.
- Ride powerful themes by checking out these 23 AI penny stocks that sit at the intersection of artificial intelligence and listed equity opportunities.
- Target income focused opportunities by reviewing these 13 dividend stocks with yields > 3% that currently offer yields above 3%.
This article by Simply Wall St is general in nature. We provide commentary based on historical data and analyst forecasts only using an unbiased methodology and our articles are not intended to be financial advice. It does not constitute a recommendation to buy or sell any stock, and does not take account of your objectives, or your financial situation. We aim to bring you long-term focused analysis driven by fundamental data. Note that our analysis may not factor in the latest price-sensitive company announcements or qualitative material. Simply Wall St has no position in any stocks mentioned.