
Please use a PC Browser to access Register-Tadawul
Get It
A Look At TechnipFMC (FTI) Valuation As Buybacks And Offshore Demand Attract Fresh Trading Interest
TechnipFMC plc FTI | 63.49 | +2.80% |
TechnipFMC (FTI) has jumped into focus after recent share buyback activity coincided with strong trading volume, tightening the spotlight on how offshore and subsea project demand could influence margins and short term price action.
At a share price of $61.36, TechnipFMC has seen strong recent momentum, with a 30 day share price return of 17.64% and a 1 year total shareholder return above 100%. Traders appear to be reacting to buybacks, heavier volume, and ongoing subsea project activity as potential drivers of both opportunity and risk.
If this kind of move in an energy name has caught your attention, it could be a good time to scan other infrastructure plays through our list of 25 power grid technology and infrastructure stocks.
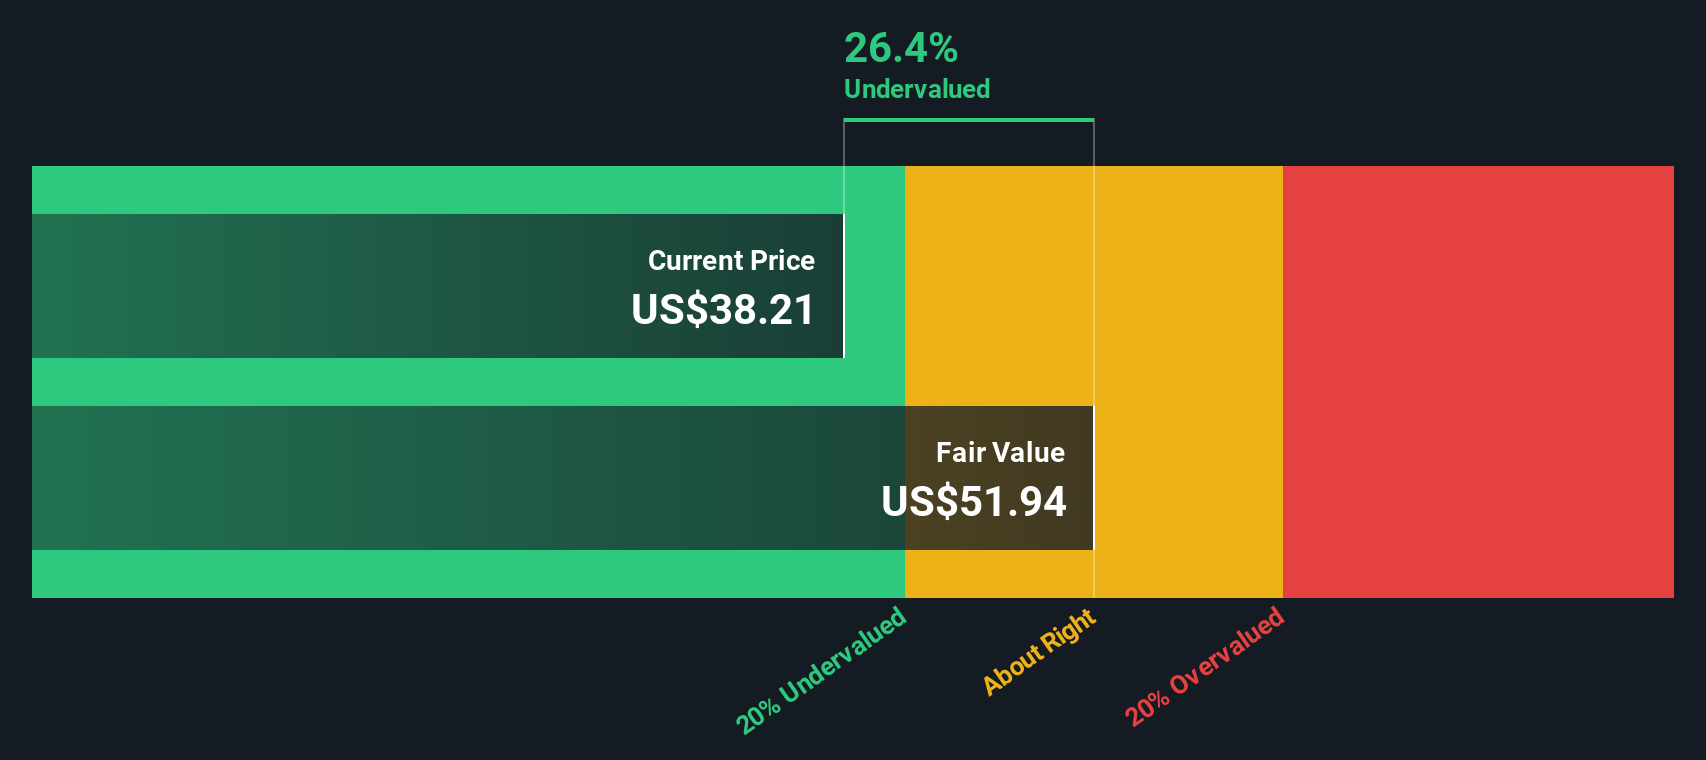
With the share price above some analyst targets but trading at an estimated 21% discount to one intrinsic value measure, the key question is whether TechnipFMC is mispriced or if the market is already baking in future growth.
With TechnipFMC last trading at $61.36 against a narrative fair value of $49.17, the current price sits well above that framework and puts the spotlight on what is being assumed about future cash generation.
Continued investment and leadership in subsea innovation (e.g., all-electric subsea systems, hybrid flexible pipe, and CO2 capture technology) position TechnipFMC to capture value from both conventional oil & gas projects and the rising demand for energy transition infrastructure such as CCS and hydrogen, fostering top-line diversification and future margin upside.
Curious what revenue path, margin profile, and earnings multiple sit behind that fair value gap? The narrative leans on steady growth, firmer profitability, and a premium future P/E to justify its view.
Result: Fair Value of $49.17 (OVERVALUED)
However, this hinges on continued offshore project momentum. Any slowdown in oil and gas investment or geopolitical disruptions could quickly challenge those cash flow and margin assumptions.
While the popular narrative flags TechnipFMC as 24.8% overvalued at $61.36 versus a $49.17 fair value, our DCF model points the other way. On this measure, the shares trade at roughly a 20.5% discount to an estimated future cash flow value of $77.22. This raises a simple question: which set of assumptions do you trust more, the story or the cash flows?
Simply Wall St performs a discounted cash flow (DCF) on every stock in the world every day (check out TechnipFMC for example). We show the entire calculation in full. You can track the result in your watchlist or portfolio and be alerted when this changes, or use our stock screener to discover 53 high quality undervalued stocks. If you save a screener we even alert you when new companies match - so you never miss a potential opportunity.
If you are not fully on board with these assumptions or simply prefer to test the numbers yourself, you can build a custom view of TechnipFMC in just a few minutes, starting with Do it your way.
A good starting point is our analysis highlighting 3 key rewards investors are optimistic about regarding TechnipFMC.
If TechnipFMC has sparked your interest, do not stop here. Use a focused screener to uncover fresh ideas that fit your style before others spot them.
This article by Simply Wall St is general in nature. We provide commentary based on historical data and analyst forecasts only using an unbiased methodology and our articles are not intended to be financial advice. It does not constitute a recommendation to buy or sell any stock, and does not take account of your objectives, or your financial situation. We aim to bring you long-term focused analysis driven by fundamental data. Note that our analysis may not factor in the latest price-sensitive company announcements or qualitative material. Simply Wall St has no position in any stocks mentioned.
