
Please use a PC Browser to access Register-Tadawul
Get It
A Look At Virtus Investment Partners (VRTS) Valuation After Recent Share Price Weakness
Virtus Investment Partners, Inc. VRTS | 146.91 | +0.29% |
Virtus Investment Partners (VRTS) has drawn investor attention after recent trading left the share price around $166.70, with mixed performance across short term moves, the month, the past 3 months, and the past year.
Recent trading has been soft, with a 1 day share price decline of 1.60% and a 7 day share price decline of 1.54%, while the 1 year total shareholder return decline of 15.95% suggests fading momentum despite a modest positive year to date share price return of 2.58%.
If Virtus Investment Partners has you reassessing your options, it can be helpful to widen the lens and check out fast growing stocks with high insider ownership as potential fresh ideas.
With Virtus trading around $166.70, some metrics hint at a potential discount to both analyst targets and certain intrinsic estimates. This raises the question: is there a genuine buying opportunity here, or is the market already pricing in future growth?
On a P/E of 8.3x, Virtus Investment Partners looks inexpensive relative to peers, with the $166.70 share price sitting well below both the peer and industry averages implied by those comparisons.
The P/E multiple compares the current share price to the company’s earnings, so a lower figure can suggest the market is placing a lower value on each dollar of profit. For an investment manager like Virtus, that matters because earnings are closely linked to fee revenue and operating efficiency.
Here, Virtus is described as good value based on its 8.3x P/E compared both to a peer average of 24.6x and to the broader US Capital Markets industry average of 25.9x. That is a substantial gap, which suggests the market is pricing Virtus at a clear discount to companies with similar business models.
Result: Price-to-Earnings of 8.3x (UNDERVALUED)
However, you also need to weigh the 3-year and 5-year total shareholder return declines, along with the recent annual revenue contraction of 3.61% as potential red flags.
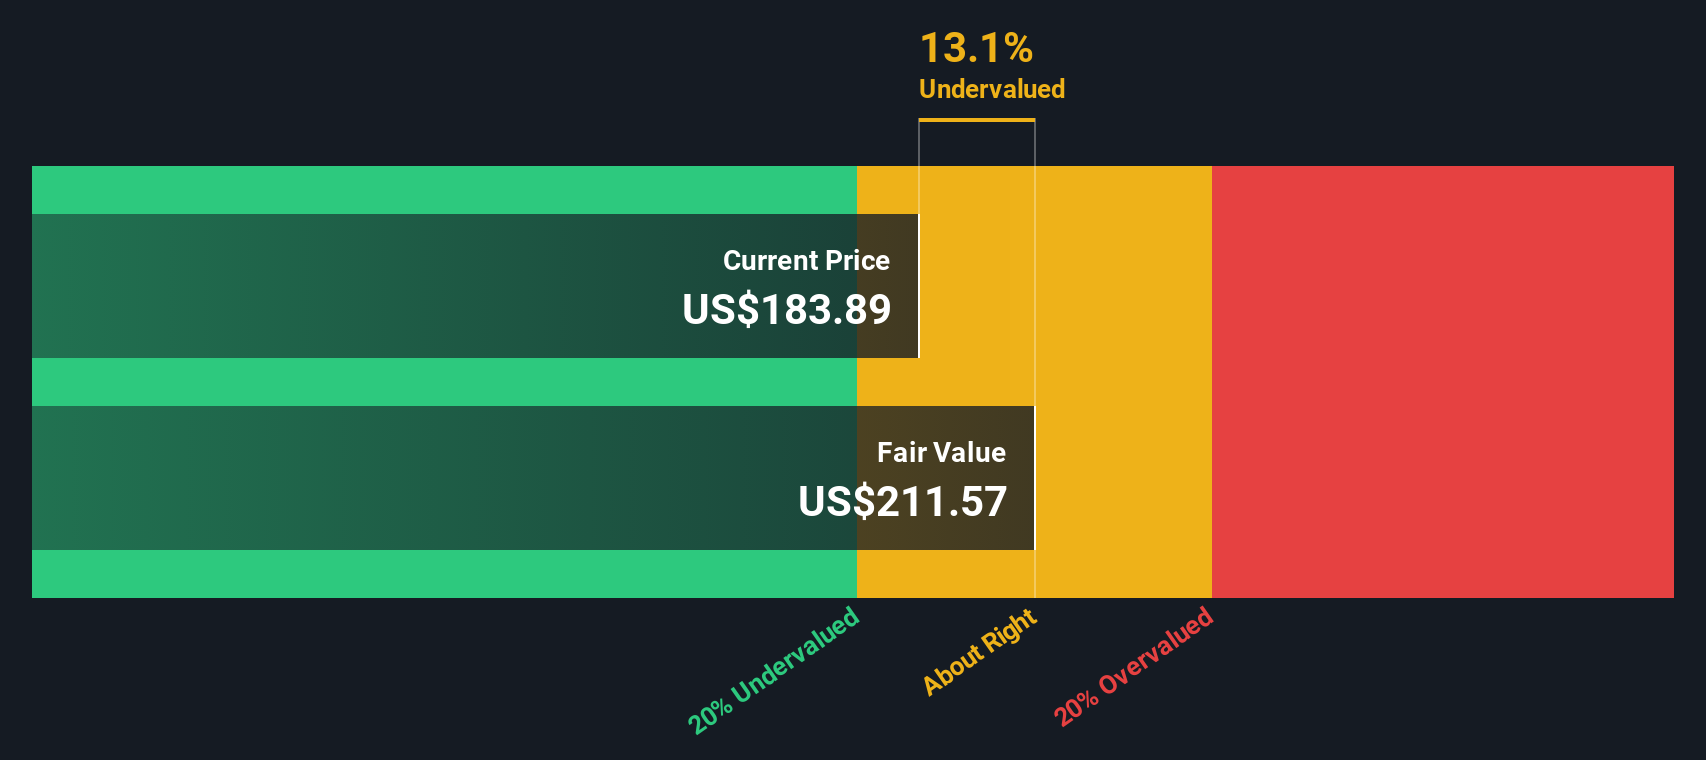
The low 8.3x P/E suggests Virtus Investment Partners is on sale. Our DCF model also points to value, with the $166.70 share price sitting about 21.8% below an estimate of future cash flow value of $213.10. If both methods flag a discount, what is the market still worried about?
Simply Wall St performs a discounted cash flow (DCF) on every stock in the world every day (check out Virtus Investment Partners for example). We show the entire calculation in full. You can track the result in your watchlist or portfolio and be alerted when this changes, or use our stock screener to discover 864 undervalued stocks based on their cash flows. If you save a screener we even alert you when new companies match - so you never miss a potential opportunity.
If you look at this and reach a different conclusion, or simply prefer to test the assumptions yourself, you can build a tailored Virtus view in just a few minutes: Do it your way.
A great starting point for your Virtus Investment Partners research is our analysis highlighting 1 key reward and 3 important warning signs that could impact your investment decision.
If Virtus does not fully fit what you want, do not stop there, use the screener to quickly surface other opportunities that match your style.
This article by Simply Wall St is general in nature. We provide commentary based on historical data and analyst forecasts only using an unbiased methodology and our articles are not intended to be financial advice. It does not constitute a recommendation to buy or sell any stock, and does not take account of your objectives, or your financial situation. We aim to bring you long-term focused analysis driven by fundamental data. Note that our analysis may not factor in the latest price-sensitive company announcements or qualitative material. Simply Wall St has no position in any stocks mentioned.
