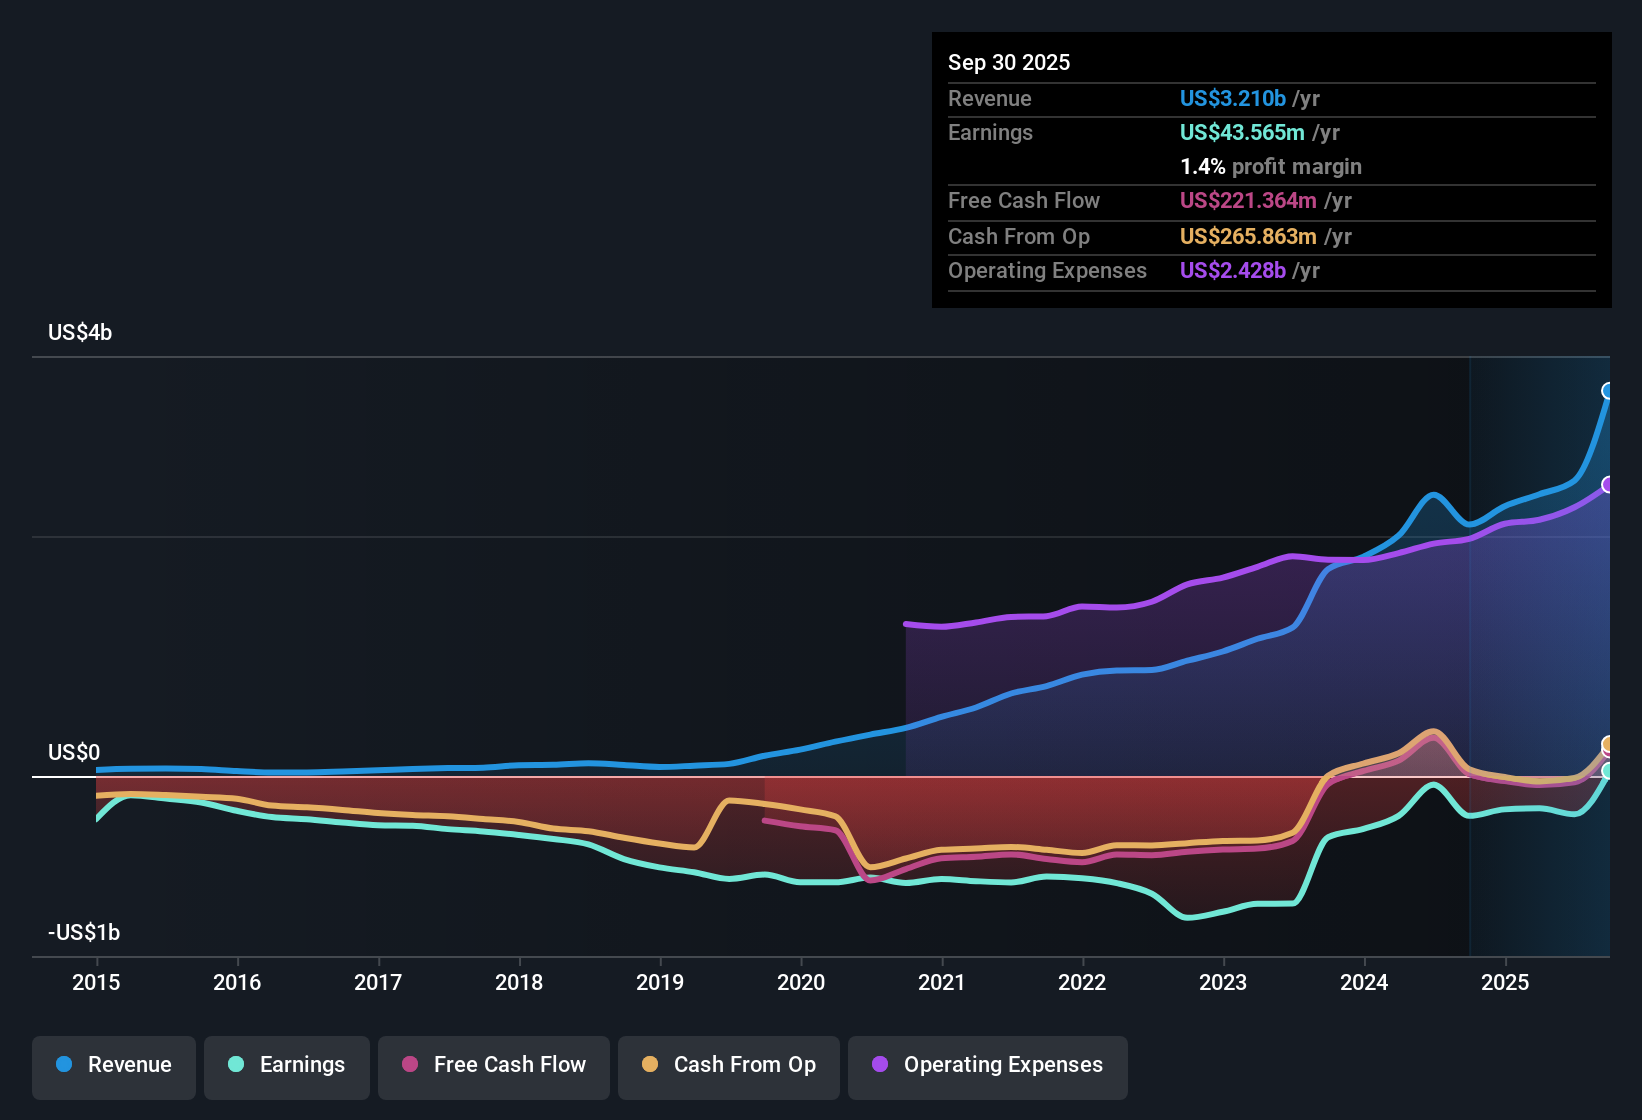
Alnylam Pharmaceuticals (ALNY) has capped FY 2025 with fourth quarter revenue of US$1,097.0 million and basic EPS of US$1.41, alongside net income of US$186.4 million that continues the company’s recent move into profitability. The company has seen revenue step up from US$593.2 million and basic EPS of US$0.65 loss in Q4 2024 to US$594.2 million with EPS of US$0.44 loss in Q1 2025, US$773.7 million with EPS of US$0.51 loss in Q2, US$1,249.0 million with EPS of US$1.91 in Q3, and now above US$1.0 billion with positive EPS again in Q4. This sets the stage for investors to weigh how the shift from losses to profits might shape margins from here.
See our full analysis for Alnylam Pharmaceuticals.
With the headline numbers on the table, the next step is to see how this path to profitability lines up with the widely followed bull and bear narratives around Alnylam’s growth, risk profile, and long term earnings story.
NasdaqGS:ALNY Earnings & Revenue History as at Feb 2026
Trailing US$3.7b revenue and first full year in profit
On a trailing twelve month basis, Alnylam generated US$3.7b of revenue and US$313.7 million of net income, with basic EPS over that period at US$2.39.
Consensus narrative points to growing adoption of core RNAi drugs and international launches as the main drivers of this revenue base. The move from a loss of US$278.2 million at the end of 2024 to a profit of US$313.7 million over the latest twelve months suggests the operating model is starting to show leverage, even as bears focus on ongoing R&D and SG&A spend.
Profitability emerges alongside high 132.9x P/E
The trailing P/E multiple of 132.9x is being applied to a company that has just turned profitable over the past year, with five year annualized earnings growth of 34.6% and reported net income of US$186.4 million in Q4 2025 following losses in Q1 and Q2.
Bears argue that this high multiple leaves little room for error, yet the bearish narrative itself assumes revenue growth of 19.4% a year and margins rising from a loss of 13.0% to a 3.3% profit margin, which sits uneasily beside the fact that Alnylam has already reported positive trailing twelve month net income of US$313.7 million and basic EPS of US$2.39.
The fact that bears are still using loss making starting points while the latest data shows the company in profit suggests their caution is more about how long growth can be maintained than about current profitability.
At the same time, the P/E gap to the US biotech industry average of 22.2x underlines why these concerns about sustaining earnings matter so much for anyone watching the share price at US$314.40.
Skeptics warn that the rich multiple and reliance on TTR therapies could make any stumble costly for shareholders, and still see reasons to focus on execution risks over the next few years.
🐻 Alnylam Pharmaceuticals Bear Case
Forecast growth vs current price gap
Analysis highlights forecast earnings growth of about 30.4% a year and revenue growth of about 19.6% a year, while the shares trade around US$314.40 against an analyst price target reference of US$465.46 and a DCF fair value estimate of US$698.02.
Bullish investors highlight that Alnylam is already profitable with trailing twelve month net income of US$313.7 million, and refer to scenarios where revenue grows 41.8% a year or more and profit margins rise from a loss of 13.0% to as high as 26.8%. However, the current 132.9x P/E and reliance on a single franchise mean these forecasts need to hold up to justify the gap between US$314.40 and both the US$465.46 target and the DCF fair value of US$698.02.
What stands out for the bullish case is that analysts in the dataset see the stock trading materially below the DCF fair value estimate while also expecting multi year earnings growth well above the broader market averages.
On the other hand, the same data flags that the industry trades on a P/E closer to 22.2x, so the debate is really about whether Alnylam can sustain those higher growth rates long enough for that premium to make sense.
Bulls argue that the latest move into profit and the growth runway for RNAi therapies could justify that gap if the company keeps delivering against those forecasts, and see today’s valuation debate as a question of timing rather than direction.
🐂 Alnylam Pharmaceuticals Bull Case
Next Steps
To see how these results tie into long-term growth, risks, and valuation, check out the full range of community narratives for Alnylam Pharmaceuticals on Simply Wall St. Add the company to your watchlist or portfolio so you'll be alerted when the story evolves.
See the numbers differently, identify patterns others might be missing, and turn that view into your own narrative in just a few minutes, starting with Do it your way
A great starting point for your Alnylam Pharmaceuticals research is our analysis highlighting 4 key rewards and 1 important warning sign that could impact your investment decision.
See What Else Is Out There
Alnylam’s rich 132.9x P/E, reliance on a single franchise and debate over sustaining high growth leave little margin for error at the current price.
If that premium and concentration risk make you uneasy, balance your watchlist with our 85 resilient stocks with low risk scores that prioritize steadier profiles and potentially calmer ride potential.
This article by Simply Wall St is general in nature. We provide commentary based on historical data and analyst forecasts only using an unbiased methodology and our articles are not intended to be financial advice. It does not constitute a recommendation to buy or sell any stock, and does not take account of your objectives, or your financial situation. We aim to bring you long-term focused analysis driven by fundamental data. Note that our analysis may not factor in the latest price-sensitive company announcements or qualitative material. Simply Wall St has no position in any stocks mentioned.