
Please use a PC Browser to access Register-Tadawul
Get It
Appian (APPN) Valuation Check After Prolonged Share Price Weakness And Conflicting Fair Value Signals
Appian Corporation Class A APPN | 25.14 | +2.44% |
Appian (APPN) is back on investor radars after recent trading pressure, with the share price closing at US$28.62 and posting negative returns over the past week, month, past 3 months, year, and 5 years.
The recent 7 day share price return of a 15.33% decline and 30 day share price return of a 22.31% decline, alongside a 1 year total shareholder return of a 12.74% decline and 5 year total shareholder return of an 86.03% decline, suggests momentum has been fading rather than building for some time.
If Appian’s swings have you rethinking your exposure to software, it could be a good moment to broaden your watchlist with high growth tech and AI stocks as potential alternatives.
With Appian delivering annual revenue growth alongside a net loss and the share price well below the average analyst target, you have to ask: is the recent weakness an entry point, or is the market already pricing in future growth?
With Appian last closing at US$28.62 against a fair value estimate of US$41.60, the most followed narrative frames today’s price as a discount and anchors that view on medium term growth, margin improvement, and a specific profit multiple a few years out.
Broad enterprise demand for application modernization and workflow automation is accelerating, with AI seen as a catalyst that dramatically lowers modernization costs and complexity. This is positioning Appian's platform for increased adoption, larger deal sizes, and improved revenue growth over the coming years.
Curious what assumptions turn today’s loss making profile into future earnings? Revenue compounding, margin reset, and a premium multiple all sit at the core of this fair value story. Want to see how those pieces are stitched together, year by year, into that US$41.60 figure and beyond?
Result: Fair Value of $41.60 (UNDERVALUED)
However, this hinges on Appian defending its low code niche against larger platform rivals and avoiding a prolonged drag from heavy R&D and sales spend.
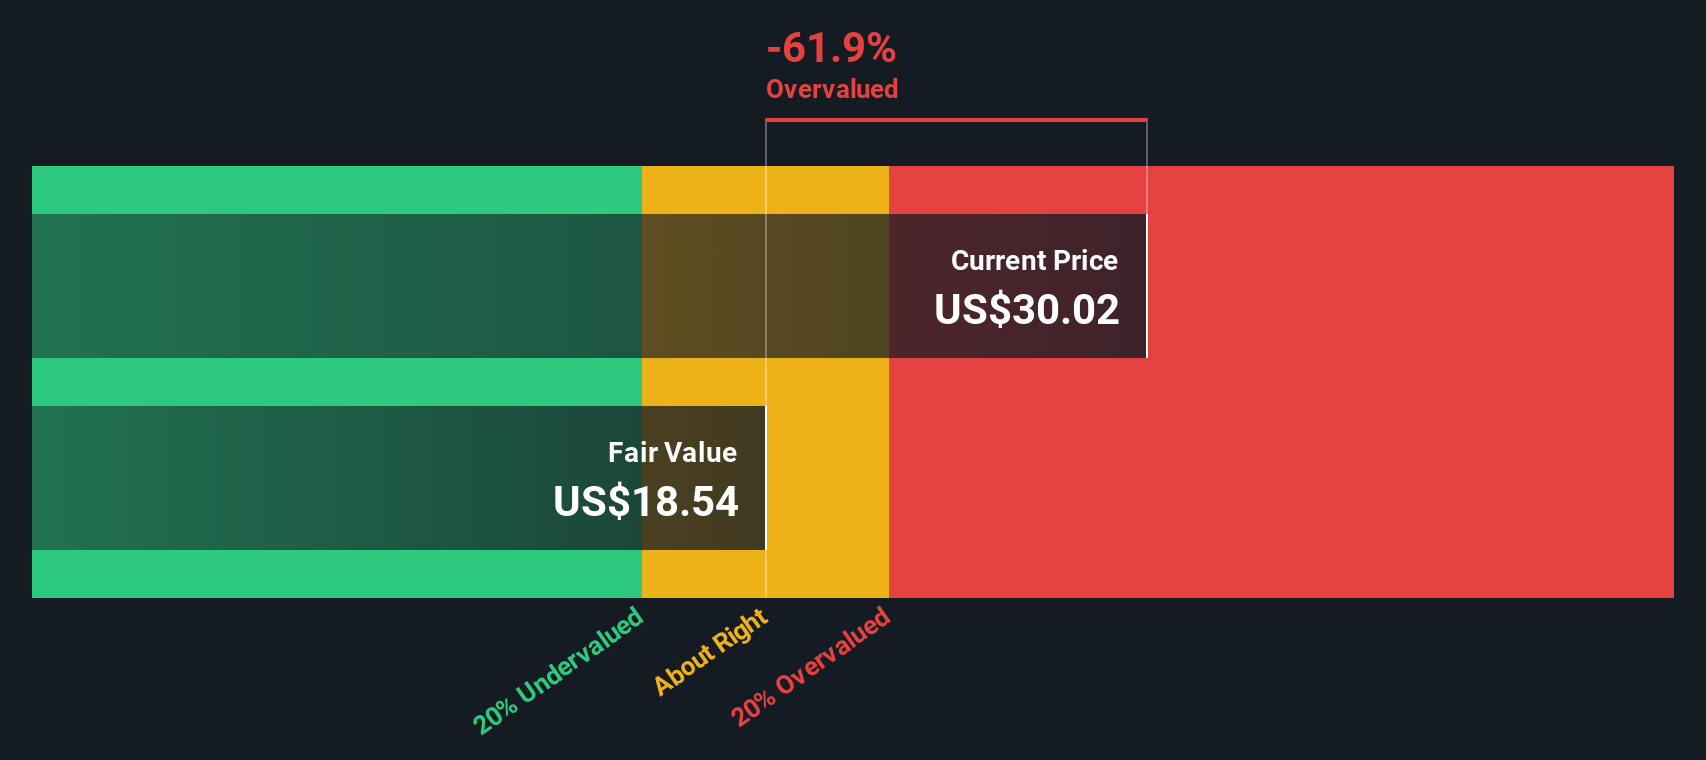
While the popular narrative sees Appian as 31.2% undervalued at a fair value of US$41.60, our DCF model tells a different story. On that framework, the shares at US$28.62 sit above an estimated fair value of US$26.87, which points to a modest overvaluation instead of a discount. It raises the question: which set of assumptions feels closer to how you see Appian playing out?
Simply Wall St performs a discounted cash flow (DCF) on every stock in the world every day (check out Appian for example). We show the entire calculation in full. You can track the result in your watchlist or portfolio and be alerted when this changes, or use our stock screener to discover 873 undervalued stocks based on their cash flows. If you save a screener we even alert you when new companies match - so you never miss a potential opportunity.
If this take on Appian does not quite match how you see the business, you can step through the numbers yourself and shape a custom view in minutes, starting with Do it your way.
A great starting point for your Appian research is our analysis highlighting 3 key rewards and 2 important warning signs that could impact your investment decision.
If Appian’s mixed signals have you thinking bigger, this is the moment to widen your field of view and line up a few fresh contenders.
This article by Simply Wall St is general in nature. We provide commentary based on historical data and analyst forecasts only using an unbiased methodology and our articles are not intended to be financial advice. It does not constitute a recommendation to buy or sell any stock, and does not take account of your objectives, or your financial situation. We aim to bring you long-term focused analysis driven by fundamental data. Note that our analysis may not factor in the latest price-sensitive company announcements or qualitative material. Simply Wall St has no position in any stocks mentioned.
