Ashland (ASH) has opened its Q1 2026 scorecard with revenue of US$386 million and a basic EPS loss of US$0.30, putting fresh numbers on a story that already features trailing 12 month revenue of about US$1.8 billion and a full year EPS loss of US$14.64. Over recent quarters the company has seen revenue move between US$405 million and US$522 million while quarterly EPS has swung from a profit of US$0.72 to a loss of US$15.63, setting the stage for investors to judge how far current margins go toward supporting the longer term turnaround and growth narrative.
See our full analysis for Ashland.
With the latest figures on the table, the next step is to see how these margins and loss trends line up with the widely followed Ashland narratives and where the fresh data starts to push back against those expectations.
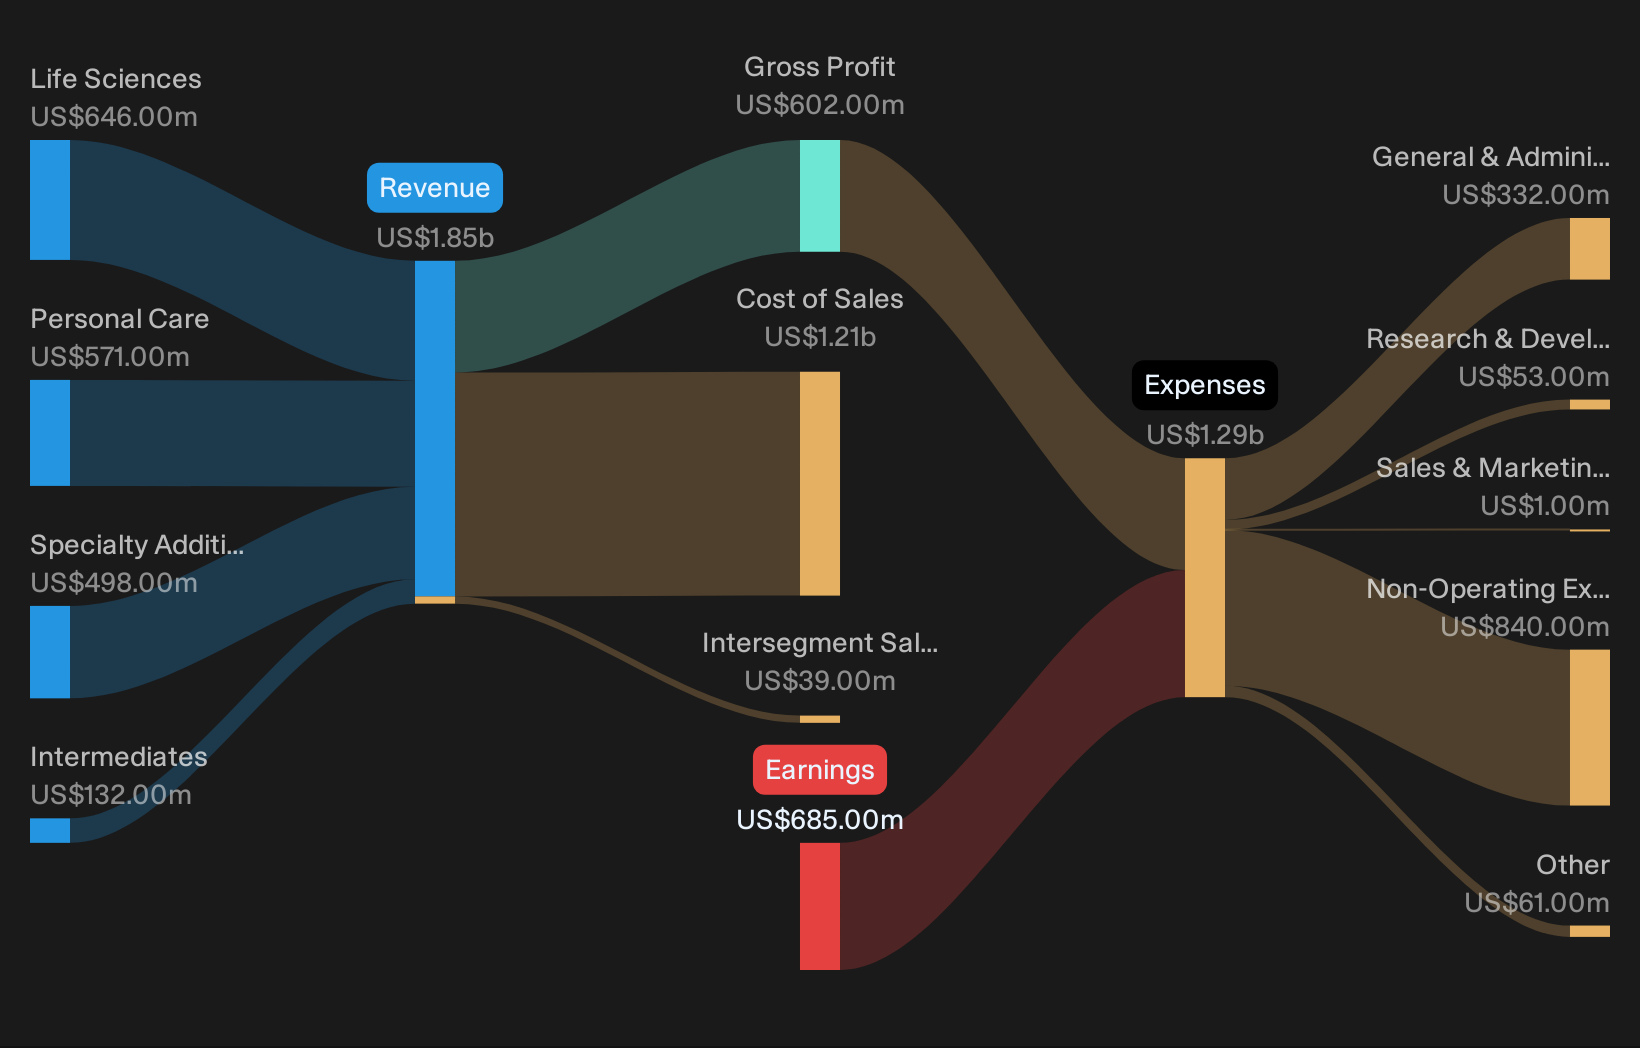
NYSE:ASH Revenue & Expenses Breakdown as at Feb 2026
Losses Continue With US$14 Million Q1 Hit
Q1 2026 shows net income excluding extra items at a loss of US$14 million, compared with a profit of US$33 million in Q4 2025 and a loss of US$719 million in Q3 2025, while trailing 12 month net income sits at a loss of US$670 million on US$1.8b of revenue.
Bears focus on the company being unprofitable on a trailing basis, and the recent figures keep that concern front and center, with Q1 still in the red and losses over the past five years expanding at about 38% per year, even though some individual quarters like Q2 and Q4 2025 showed profits.
Revenue Growth Slows To 3.8% Over Year
On a trailing 12 month basis, revenue is US$1.8b with a 3.8% growth rate over the last year, compared with earlier trailing periods between US$1.9b and US$2.1b and a cited broader US market growth rate of 10.1% per year.
What stands out for a more bullish take is that supporters often highlight Ashland as a specialty ingredients business with exposure to relatively steady end markets like pharmaceuticals and personal care. However, the 3.8% revenue growth rate and the step down from earlier trailing revenues of around US$2.1b and US$2.0b show that, in the recent data provided, top line trends are not matching the stronger growth profile that optimists often associate with these kinds of defensive segments.
This gap between the 3.8% growth rate and the 10.1% market figure can challenge the idea that Ashland is currently growing faster than the broader opportunity set.
The pattern of quarterly sales between US$386 million and US$522 million over the last six reported quarters also shows that revenue has moved around within a relatively tight band rather than clearly accelerating in the period covered.
📊 Read the full Ashland Consensus Narrative.
Valuation Gap Versus DCF Fair Value
The shares trade at US$61.08 with a P/S of 1.5x compared with a DCF fair value of US$183.35 and a cited analyst price target of US$65.20, while that 1.5x P/S sits above both the 1.1x US chemicals industry average and the 1.3x peer average.
Supporters of the more bullish view point to the DCF fair value being very far above the current price and forecast earnings growth of about 107.89% per year over the next few years. At the same time, the higher P/S multiple relative to industry and peers and the fact that the company is still generating a trailing 12 month loss of US$670 million highlight that the optimistic valuation case rests heavily on those future improvements turning up in the financials rather than on the current profit profile.
The combination of a higher P/S multiple and ongoing losses means the market is already paying more per dollar of sales than the industry averages even before any turnaround is evident in trailing earnings.
At the same time, the 2.72% dividend yield is not well covered by trailing earnings, which adds another layer of risk for income focused investors who are weighing that DCF fair value gap against current cash flow coverage.
Next Steps
Don't just look at this quarter; the real story is in the long-term trend. We've done an in-depth analysis on Ashland's growth and its valuation to see if today's price is a bargain. Add the company to your watchlist or portfolio now so you don't miss the next big move.
Explore Alternatives
Ashland is still posting sizeable losses on a trailing basis, its 3.8% revenue growth trails the cited broader US market figure, and the current dividend is not well covered by earnings.
If you want ideas where income looks better supported, use our these 1776 dividend stocks with yields > 3% today to quickly zero in on companies offering yields with stronger earnings coverage and consistency.
This article by Simply Wall St is general in nature. We provide commentary based on historical data and analyst forecasts only using an unbiased methodology and our articles are not intended to be financial advice. It does not constitute a recommendation to buy or sell any stock, and does not take account of your objectives, or your financial situation. We aim to bring you long-term focused analysis driven by fundamental data. Note that our analysis may not factor in the latest price-sensitive company announcements or qualitative material. Simply Wall St has no position in any stocks mentioned.