
Please use a PC Browser to access Register-Tadawul
Get It
Assessing Appian (APPN) Valuation After Recent Share Price Pullback And Long Term Automation Prospects
Appian Corporation Class A APPN | 25.14 | +2.44% |
With no single headline event driving attention, Appian (APPN) is drawing interest as investors weigh its recent share performance, revenue and earnings profile, as well as how its automation platform fits into broader software portfolios.
At a share price of US$34.67, Appian’s recent 30 day share price return of a 19.47% decline contrasts with a 21.61% gain over 90 days and a relatively flat 1 year total shareholder return. This pattern hints that momentum has cooled after a stronger quarter.
If you are comparing Appian with other software names riding the automation and AI trend, it could be worth sizing up high growth tech and AI stocks as a fresh source of ideas.
With the shares down over 30 days but still ahead over 90 days and trading below the average analyst price target, the real question is whether Appian is underappreciated at this level or if the market is already accounting for potential future growth.
With Appian closing at US$34.67 against a narrative fair value of US$41.60, the current setup centers on whether that gap is justified by its long term cash flow potential.
Broad enterprise demand for application modernization and workflow automation is accelerating, with AI seen as a catalyst that dramatically lowers modernization costs and complexity, positioning Appian's platform for increased adoption, larger deal sizes, and improved revenue growth over the coming years.
Curious what kind of revenue path and margin lift could underpin that higher fair value. The narrative leans on recurring cloud growth, richer deal economics, and a future earnings multiple that assumes sustained adoption. Want to see how those moving parts fit together in the full model.
Result: Fair Value of $41.60 (UNDERVALUED)
However, there are real pressure points here, ranging from larger platform rivals crowding into low code automation to questions about whether customer expansion can keep recurring revenue resilient.
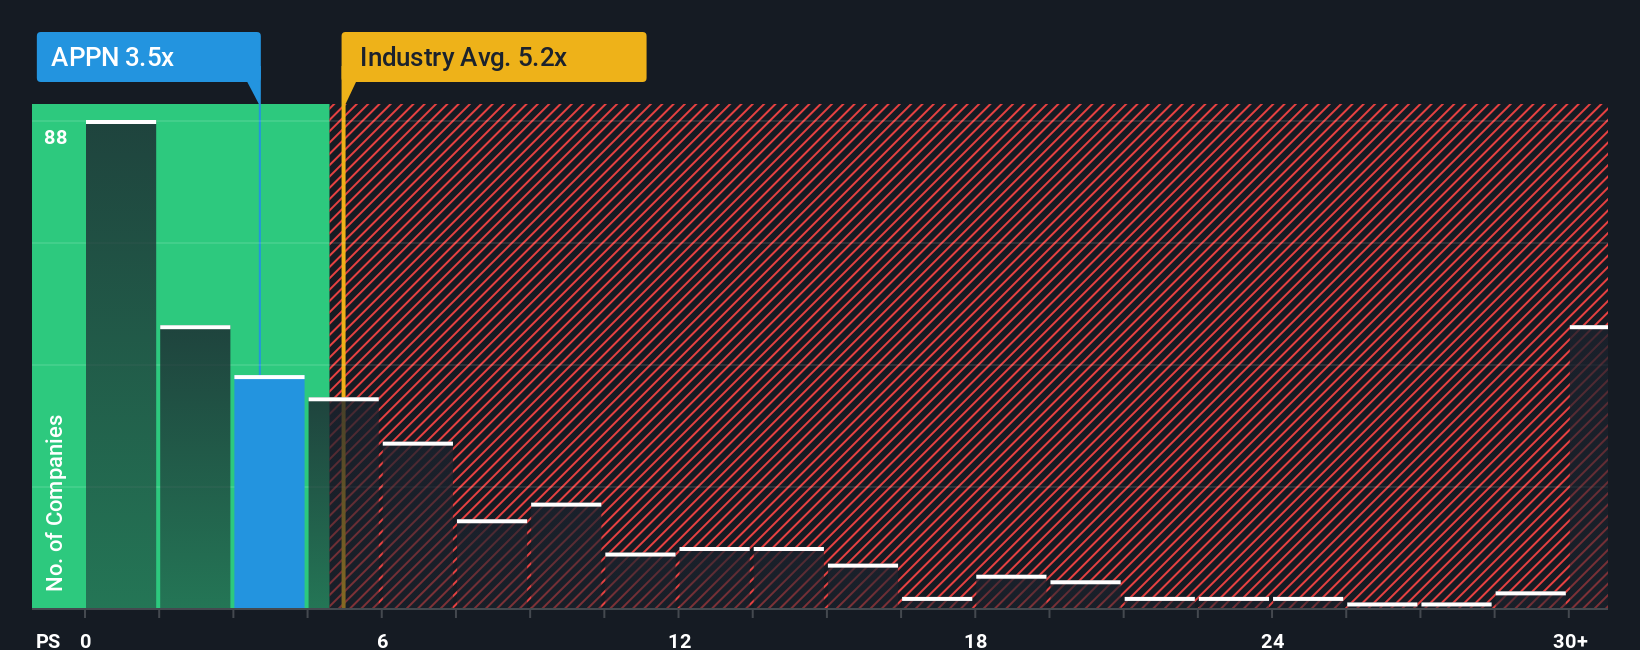
While the narrative fair value of US$41.60 points to upside, the simple sales multiple paints a more cautious picture. Appian trades on a P/S of 3.7x, richer than similar peers at 2.9x, but below the broader US software group at 4.9x and under a fair ratio of 4.6x. That mix of premium and discount raises a basic question for you: is this sensible pricing for the risk profile, or a sign expectations are uneven?
If you see the numbers differently or simply prefer to test your own assumptions, you can build a custom view of Appian in minutes with Do it your way.
A great starting point for your Appian research is our analysis highlighting 1 key reward and 1 important warning sign that could impact your investment decision.
If Appian is already on your radar, do not stop there. Broaden your watchlist with a few focused screens that surface different types of opportunities.
This article by Simply Wall St is general in nature. We provide commentary based on historical data and analyst forecasts only using an unbiased methodology and our articles are not intended to be financial advice. It does not constitute a recommendation to buy or sell any stock, and does not take account of your objectives, or your financial situation. We aim to bring you long-term focused analysis driven by fundamental data. Note that our analysis may not factor in the latest price-sensitive company announcements or qualitative material. Simply Wall St has no position in any stocks mentioned.
