Assessing ASA Gold and Precious Metals (ASA) Valuation After Strong Earnings And Increased Saba Capital Ownership
ASA Gold and Precious Metals Limited ASA | 0.00 |
ASA Gold and Precious Metals (ASA) has moved into focus after reporting full year 2025 results, with revenue of US$3.98 million and net income of US$664.07 million, alongside fresh buying from major shareholder Saba Capital Management.
The latest results and Saba Capital's recent buying arrive after a sharp pullback, with a 1 day share price return of 10.4% decline and a 7 day return of 12.32% decline. However, the stock has shown strong underlying momentum, including a 30 day share price return of 8.16%, a 90 day share price return of 40.43%, and a 1 year total shareholder return of 176.39%. This points to a stock where sentiment has been volatile but longer term gains remain substantial.
If earnings driven moves like ASA's have your attention, this could be a good moment to broaden your search with fast growing stocks with high insider ownership.
With earnings screens flagging ASA, insider buying from Saba Capital, and the share price still swinging around, the key question is whether the current valuation leaves room for upside or if the market is already pricing in future growth.
Preferred Multiple of 3.2x P/E: Is it justified?
ASA Gold and Precious Metals is trading on a P/E of 3.2x, which looks low next to recent share price gains and could signal that earnings are being priced cautiously.
The P/E ratio compares the share price to earnings per share and is a quick way to see how much investors are paying for each dollar of profit. For an investment company like ASA, which reports earnings from its portfolio and other income sources, the P/E can swing sharply when one off gains or losses flow through the income statement.
In ASA's case, recent earnings include a very large one off gain of $377.1m, which has pushed reported profit and return on equity higher and helped bring the P/E ratio down. At the same time, the company has a track record of earnings growth over the past 5 years, and earnings growth over the past year has been much faster than its own 5 year average and the wider US Capital Markets industry. That mix of a low P/E and fast historical earnings growth raises the question of how much of those past gains investors expect to persist once one off items fade.
Compared with the broader US market P/E of 19.2x, ASA's 3.2x looks very low. Against the US Capital Markets industry average P/E of 23.9x and a peer average of 27.4x, the discount is even more pronounced, which suggests the market is valuing ASA's earnings at a steep discount to both the market and its closest comparables.
Result: Price-to-earnings of 3.2x (UNDERVALUED)
However, the story leans heavily on a one off US$377.1m gain and concentrated exposure to precious metals, which could both shift sentiment quickly.
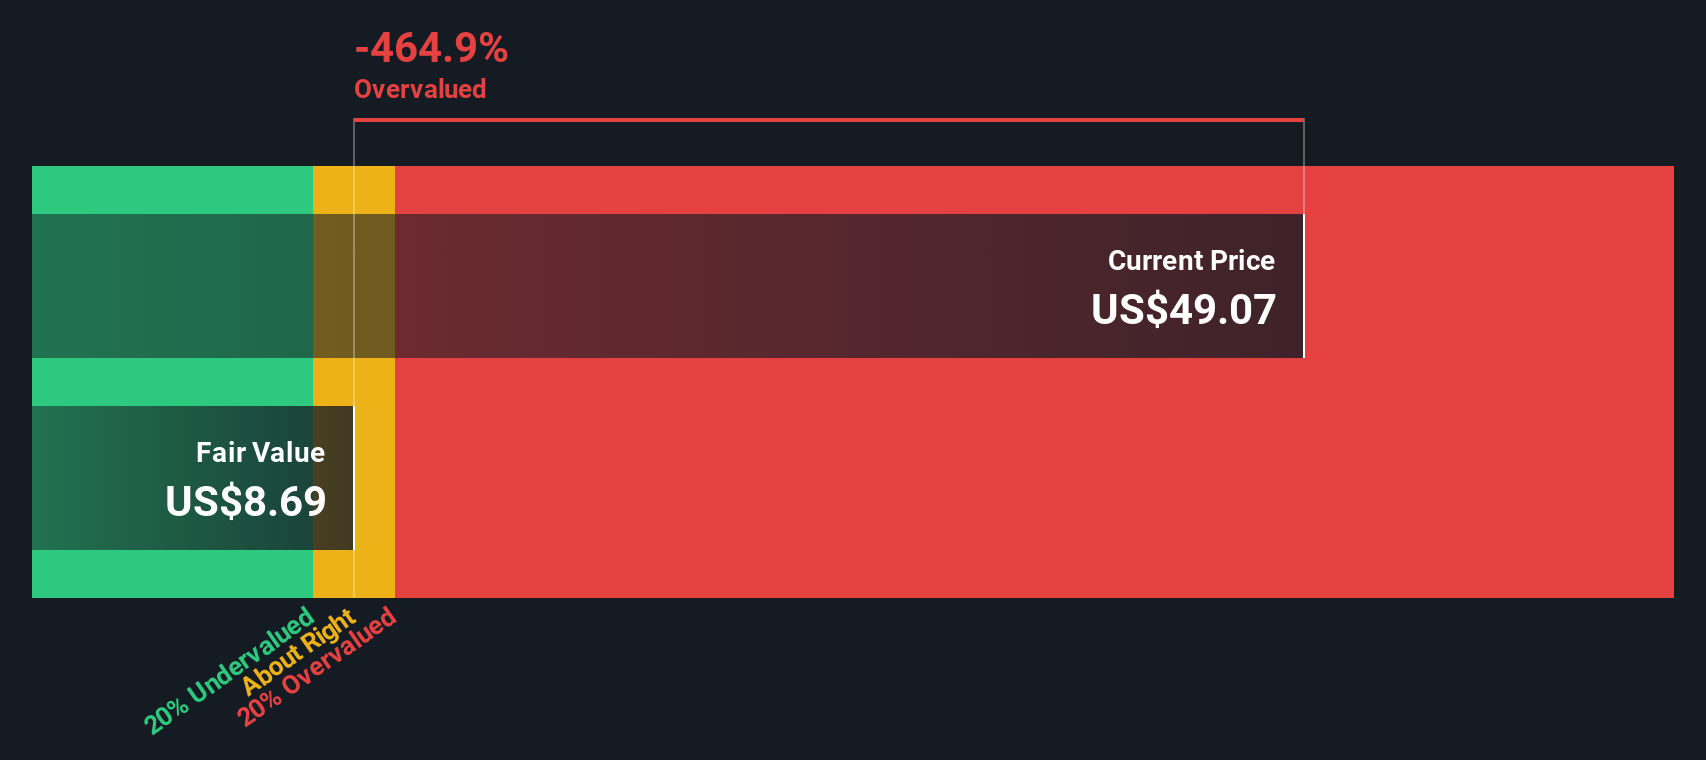
Another View: DCF Points the Other Way
While the 3.2x P/E suggests ASA Gold and Precious Metals is cheap, our DCF model comes to a very different conclusion. With the share price at $64.54 and a future cash flow value estimate of $24.69, ASA screens as expensive on this method. This puts the burden back on you: which story do you trust more?
Simply Wall St performs a discounted cash flow (DCF) on every stock in the world every day (check out ASA Gold and Precious Metals for example). We show the entire calculation in full. You can track the result in your watchlist or portfolio and be alerted when this changes, or use our stock screener to discover 868 undervalued stocks based on their cash flows. If you save a screener we even alert you when new companies match - so you never miss a potential opportunity.
Build Your Own ASA Gold and Precious Metals Narrative
If you see the data differently or prefer to rely on your own research, you can build a custom view of ASA in just a few minutes, starting with Do it your way.
A great starting point for your ASA Gold and Precious Metals research is our analysis highlighting 2 key rewards and 2 important warning signs that could impact your investment decision.
Looking for more investment ideas?
If ASA has sharpened your focus, do not stop here, use the Simply Wall St Screener to spot other opportunities that could fit your approach.
- Target reliable income streams by scanning these 14 dividend stocks with yields > 3% that might suit a portfolio focused on regular cash returns.
- Spot potential mispricings by reviewing these 868 undervalued stocks based on cash flows that appear cheap relative to their cash flow profiles.
- Get ahead of sector shifts by checking these 18 cryptocurrency and blockchain stocks tied to blockchain, digital assets, and related infrastructure.
This article by Simply Wall St is general in nature. We provide commentary based on historical data and analyst forecasts only using an unbiased methodology and our articles are not intended to be financial advice. It does not constitute a recommendation to buy or sell any stock, and does not take account of your objectives, or your financial situation. We aim to bring you long-term focused analysis driven by fundamental data. Note that our analysis may not factor in the latest price-sensitive company announcements or qualitative material. Simply Wall St has no position in any stocks mentioned.