
Please use a PC Browser to access Register-Tadawul
Get It
Assessing CG Oncology (CGON) Valuation After Accelerated PIVOT-006 Phase 3 Trial Timeline
CG Oncology, Inc. CGON | 57.63 | +2.14% |
CG Oncology (CGON) is back in focus after accelerating the topline data timeline for its Phase 3 PIVOT-006 trial, the first randomized study for intermediate-risk non muscle invasive bladder cancer patients.
The accelerated PIVOT-006 timeline sits against a strong recent run, with a 30 day share price return of 40.23% and a 1 year total shareholder return of 88.20%, suggesting momentum has been building around the story.
If CG Oncology’s progress has your attention, this can be a useful moment to review other specialised drug developers through our screener for healthcare stocks.
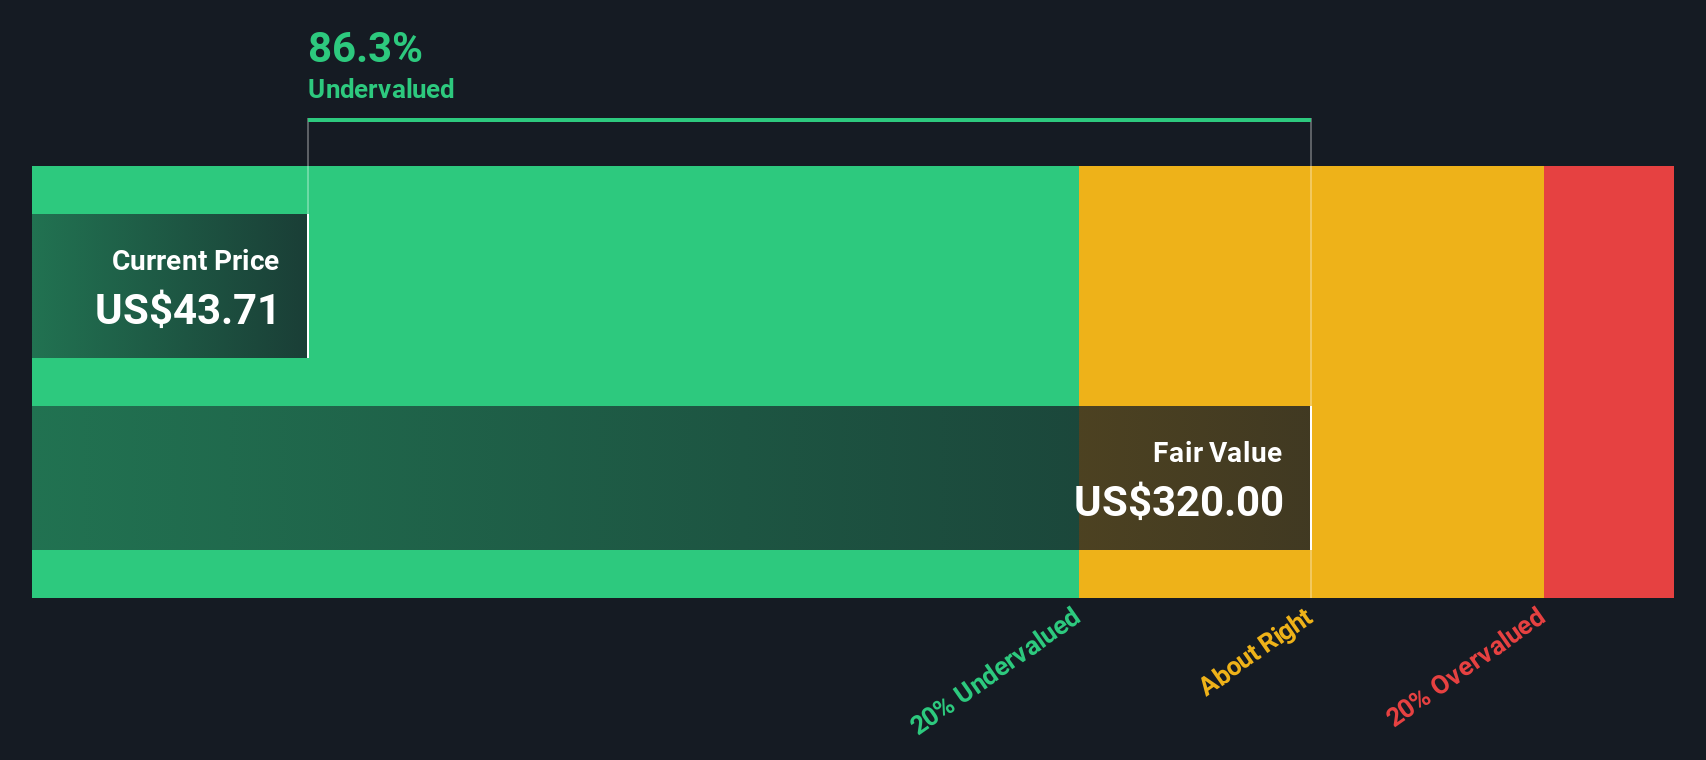
With CG Oncology trading at US$54.73 and sitting at what screens as an 81.09% discount to one intrinsic value estimate, as well as about a 41.87% discount to the average analyst target, is there still a genuine opportunity here or has the market already priced in the future growth story?
CG Oncology’s recent close at US$54.73 corresponds to a P/B of 6.4x, which appears expensive compared with the wider US biotech group but lower than a selected peer set.
P/B compares the market value of the company with the book value of its net assets. It is often used for pre-revenue or unprofitable biopharma companies where earnings-based ratios are less informative.
In this case, CG Oncology’s 6.4x P/B is described as expensive relative to the broader US Biotechs industry average of 2.6x, yet it is characterized as good value compared with a peer average of 8.9x. This indicates that investors are paying a premium to the sector overall, but not at the top end of the peer range.
Result: Price to Book of 6.4x (ABOUT RIGHT)
However, you still need to weigh the clinical risk across multiple trials and the reported net loss of US$151.484 million against that apparent valuation gap.
While the 6.4x P/B suggests CG Oncology screens as expensive against the broader US biotech group, our DCF model points in a very different direction. On that approach, the shares at US$54.73 sit around 81.1% below an estimated fair value of US$289.42. This is a big gap for you to judge: is it a margin of safety or a sign that expectations are too optimistic?
Simply Wall St performs a discounted cash flow (DCF) on every stock in the world every day (check out CG Oncology for example). We show the entire calculation in full. You can track the result in your watchlist or portfolio and be alerted when this changes, or use our stock screener to discover 873 undervalued stocks based on their cash flows. If you save a screener we even alert you when new companies match - so you never miss a potential opportunity.
If you look at these numbers and reach a different conclusion, or simply prefer to test your own thesis, you can build a personalised CG Oncology view in just a few minutes with Do it your way.
A great starting point for your CG Oncology research is our analysis highlighting 2 key rewards and 3 important warning signs that could impact your investment decision.
If you are serious about building a stronger portfolio, do not stop at one company. Widen your search now or you will likely miss useful opportunities.
This article by Simply Wall St is general in nature. We provide commentary based on historical data and analyst forecasts only using an unbiased methodology and our articles are not intended to be financial advice. It does not constitute a recommendation to buy or sell any stock, and does not take account of your objectives, or your financial situation. We aim to bring you long-term focused analysis driven by fundamental data. Note that our analysis may not factor in the latest price-sensitive company announcements or qualitative material. Simply Wall St has no position in any stocks mentioned.
