
Please use a PC Browser to access Register-Tadawul
Get It
Assessing CNA Financial (CNA) Valuation After Recent Share Price Moves And DCF Discount
CNA Financial Corporation CNA | 49.97 | +1.67% |
CNA Financial (CNA) has drawn attention after its shares delivered a 1.6% move over the past day and around 1.4% over the past week, while posting a small decline over the past month.
At a share price of $47.02, CNA’s recent 1.6% one day and 1.4% seven day share price returns sit against a modest 30 day pullback, while its 3 year total shareholder return of 37.6% and 5 year total shareholder return of 73.4% point to steadier gains for long term holders.
If CNA’s move has you looking beyond insurers, this could be a good moment to scan healthcare stocks for other income and defensively positioned names in adjacent sectors.
With CNA trading around $47, a value score of 4, an estimated 26.1% intrinsic discount and a price target sitting lower at $44, you have to ask: is this a genuine mispricing or is the market already building in future growth?
Based on a P/E of 12.8x at a last close of $47.02, CNA Financial looks slightly cheaper than its peer group but roughly in line with the broader US insurance space.
The P/E multiple compares the share price with earnings per share. For insurers this ratio gives a quick read on how the market is pricing current profitability relative to other options in the sector.
CNA is described as expensive when stacked directly against the US insurance industry average P/E of 12.7x. It screens as good value versus a peer average of 15.6x and an estimated fair P/E of 15.5x, which suggests the market is assigning a lower earnings multiple than the level our fair ratio work points to as reasonable.
Result: Price-to-earnings of 12.8x (ABOUT RIGHT)
However, you also have to weigh risks such as a possible re rating closer to the US insurance P/E of 12.7x and CNA’s recent 1 year return of 1.6%.
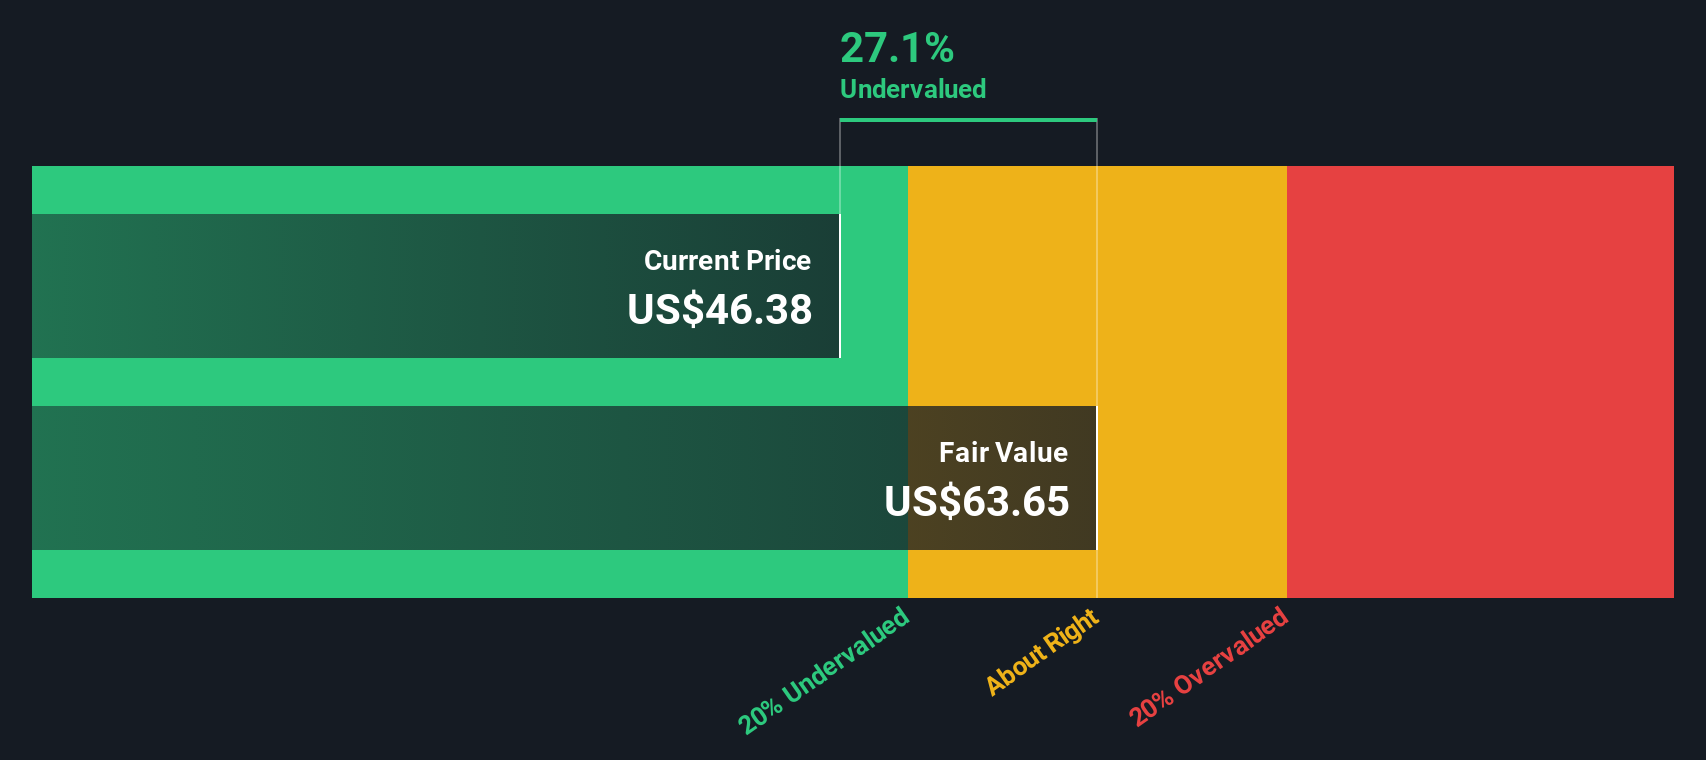
While the P/E of 12.8x suggests CNA is roughly in line with the broader US insurance group, our DCF model comes out quite differently. On those cash flow assumptions, CNA at $47.02 sits about 26.1% below an estimated fair value of $63.65, which presents a much lower implied valuation.
That kind of gap can point to either a potential opportunity or a signal that the cash flow inputs may be too optimistic, so the key question is which explanation you consider more reasonable.
Simply Wall St performs a discounted cash flow (DCF) on every stock in the world every day (check out CNA Financial for example). We show the entire calculation in full. You can track the result in your watchlist or portfolio and be alerted when this changes, or use our stock screener to discover 887 undervalued stocks based on their cash flows. If you save a screener we even alert you when new companies match - so you never miss a potential opportunity.
If this take does not quite fit how you see CNA, you can test the numbers yourself and shape your own story in minutes: Do it your way.
A great starting point for your CNA Financial research is our analysis highlighting 2 key rewards and 1 important warning sign that could impact your investment decision.
Before you move on, take a moment to scan a few focused stock lists so you do not miss opportunities that fit how you like to invest.
This article by Simply Wall St is general in nature. We provide commentary based on historical data and analyst forecasts only using an unbiased methodology and our articles are not intended to be financial advice. It does not constitute a recommendation to buy or sell any stock, and does not take account of your objectives, or your financial situation. We aim to bring you long-term focused analysis driven by fundamental data. Note that our analysis may not factor in the latest price-sensitive company announcements or qualitative material. Simply Wall St has no position in any stocks mentioned.
