
Please use a PC Browser to access Register-Tadawul
Get It
Assessing Compass Therapeutics (CMPX) Valuation After A Year Of Strong Share Price Momentum
Compass Therapeutics, Inc. CMPX | 6.59 | +3.05% |
Compass Therapeutics (CMPX) has drawn attention after recent share price moves, with the stock showing double digit returns over the past month and past 3 months despite reporting a net loss and no revenue.
At a share price of $5.70, Compass Therapeutics has a 30 day share price return of 14.92% and a 90 day share price return of 33.80%. Its 1 year total shareholder return of 119.23% suggests momentum has been building over a longer stretch despite daily pullbacks such as the recent 1 day share price decline of 1.72%.
If Compass Therapeutics has you looking closer at healthcare, this could be a good moment to broaden your watchlist with healthcare stocks that are moving for fundamental reasons.
With Compass Therapeutics still reporting no revenue and a net loss of $65.806m, yet trading at $5.70 while analyst targets sit at US$13.23, you have to ask: is this a genuine opportunity, or is the market already pricing in future growth?
At a last close of $5.70, Compass Therapeutics trades on a P/B of 4.8x, which sits close to its peer average but above the broader US biotech group.
P/B compares the market value of the company to its net assets, so for a pre revenue, loss making biotech like Compass Therapeutics it effectively reflects how investors value the pipeline, intellectual property and future cash flow potential relative to the current balance sheet.
According to the data, Compass Therapeutics is considered good value versus a peer P/B average of 4.9x. It screens as expensive against the wider US biotech industry where the P/B average is 2.6x, which suggests investors are assigning a richer multiple than the sector overall while still broadly aligning with closer peers.
Result: Price-to-book of 4.8x (ABOUT RIGHT)
However, you are still looking at a pre revenue, loss making business with a net loss of US$65.806m and drug candidates that remain in clinical development, so setbacks in trials or funding could quickly challenge today’s valuation narrative.
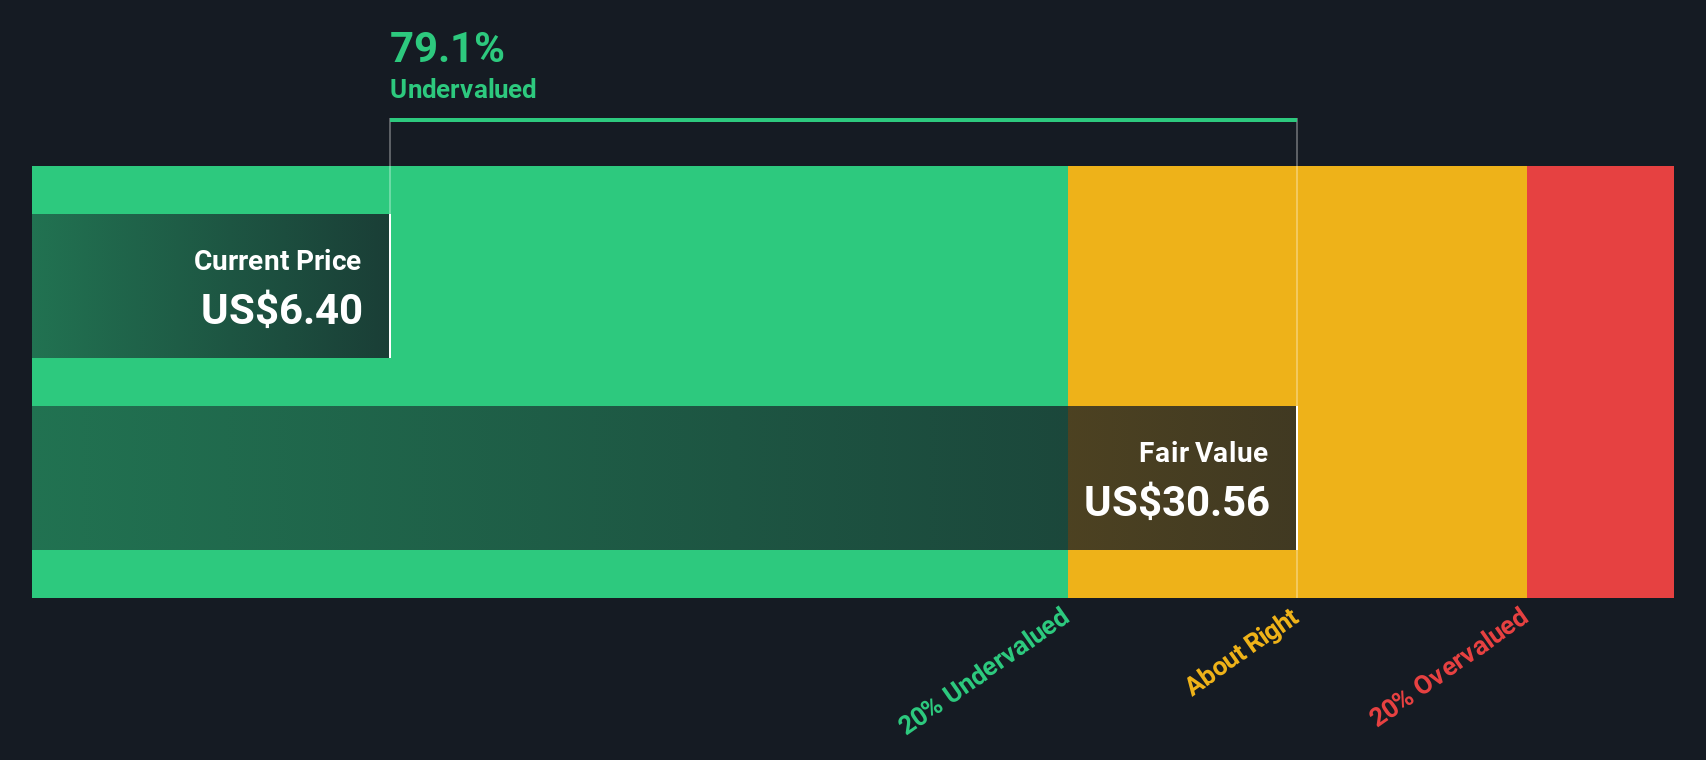
The SWS DCF model paints a very different picture to the 4.8x P/B ratio. At a share price of US$5.70 and a fair value estimate of US$30.16, Compass Therapeutics is flagged as trading well below that model’s value. If both are using reasonable assumptions, which one do you trust more?
Simply Wall St performs a discounted cash flow (DCF) on every stock in the world every day (check out Compass Therapeutics for example). We show the entire calculation in full. You can track the result in your watchlist or portfolio and be alerted when this changes, or use our stock screener to discover 863 undervalued stocks based on their cash flows. If you save a screener we even alert you when new companies match - so you never miss a potential opportunity.
If this view does not quite line up with your own, or you prefer to lean on your own work, you can build a personalized thesis in just a few minutes with Do it your way.
A great starting point for your Compass Therapeutics research is our analysis highlighting 2 key rewards and 3 important warning signs that could impact your investment decision.
If Compass Therapeutics has sparked your interest, do not stop here. Use the screener to quickly surface other focused ideas that might fit your portfolio.
This article by Simply Wall St is general in nature. We provide commentary based on historical data and analyst forecasts only using an unbiased methodology and our articles are not intended to be financial advice. It does not constitute a recommendation to buy or sell any stock, and does not take account of your objectives, or your financial situation. We aim to bring you long-term focused analysis driven by fundamental data. Note that our analysis may not factor in the latest price-sensitive company announcements or qualitative material. Simply Wall St has no position in any stocks mentioned.
