
Please use a PC Browser to access Register-Tadawul
Get It
Assessing Fannie Mae (OTCPK:FNMA) Valuation After Recent Share Price Weakness And Mixed Return Signals
FEDERAL NATIONAL MORTGAGE ASSOC FNMA | 6.01 5.85 | -2.44% -2.66% Post |
Federal National Mortgage Association (FNMA) has been drawing attention after recent share price moves, with the stock around $8.19 and returns showing mixed signals across the past week, month, past 3 months, and year.
Recent trading has been weak, with a 1 day share price return of about 2% lower and a 30 day share price return of roughly 26% lower. However, the 1 year total shareholder return of 49.2% and the very large 3 year total shareholder return show that longer term holders have still seen substantial gains. This suggests recent momentum is fading after a strong multi year run.
If FNMA’s swings have you thinking about what else is moving, it could be a good time to broaden your watchlist with fast growing stocks with high insider ownership.
With the share price retreating over the past few months but a 1 year return still strong and analysts’ price targets sitting higher than today’s US$8.19, you have to ask: is there real value left here, or is the market already pricing in future growth?
On a P/S of 1.7x at a last close of $8.19, FNMA screens as inexpensive compared with similar diversified financial stocks and its own implied fair ratio.
The P/S ratio compares the company’s market value with its revenue. At 1.7x, investors are paying $1.70 for every $1 of annual sales. For a business generating $28,471.0m in revenue but currently reporting a net income loss of $2,008.0m, sales-based measures can be a simple way to compare pricing without relying on earnings.
FNMA’s 1.7x P/S sits below the US Diversified Financial industry average of 2.7x and the peer average of 2.8x. This indicates the stock is priced more conservatively than many comparables. Against an estimated fair P/S of 5.6x, the gap is even wider, which highlights a difference between the current market level and that fair ratio framework.
Result: Price-to-Sales ratio of 1.7x (UNDERVALUED)
However, you are still taking on clear risks here, including the current net income loss of $2,008.0m and the recent 25.6% 30-day share price decline.
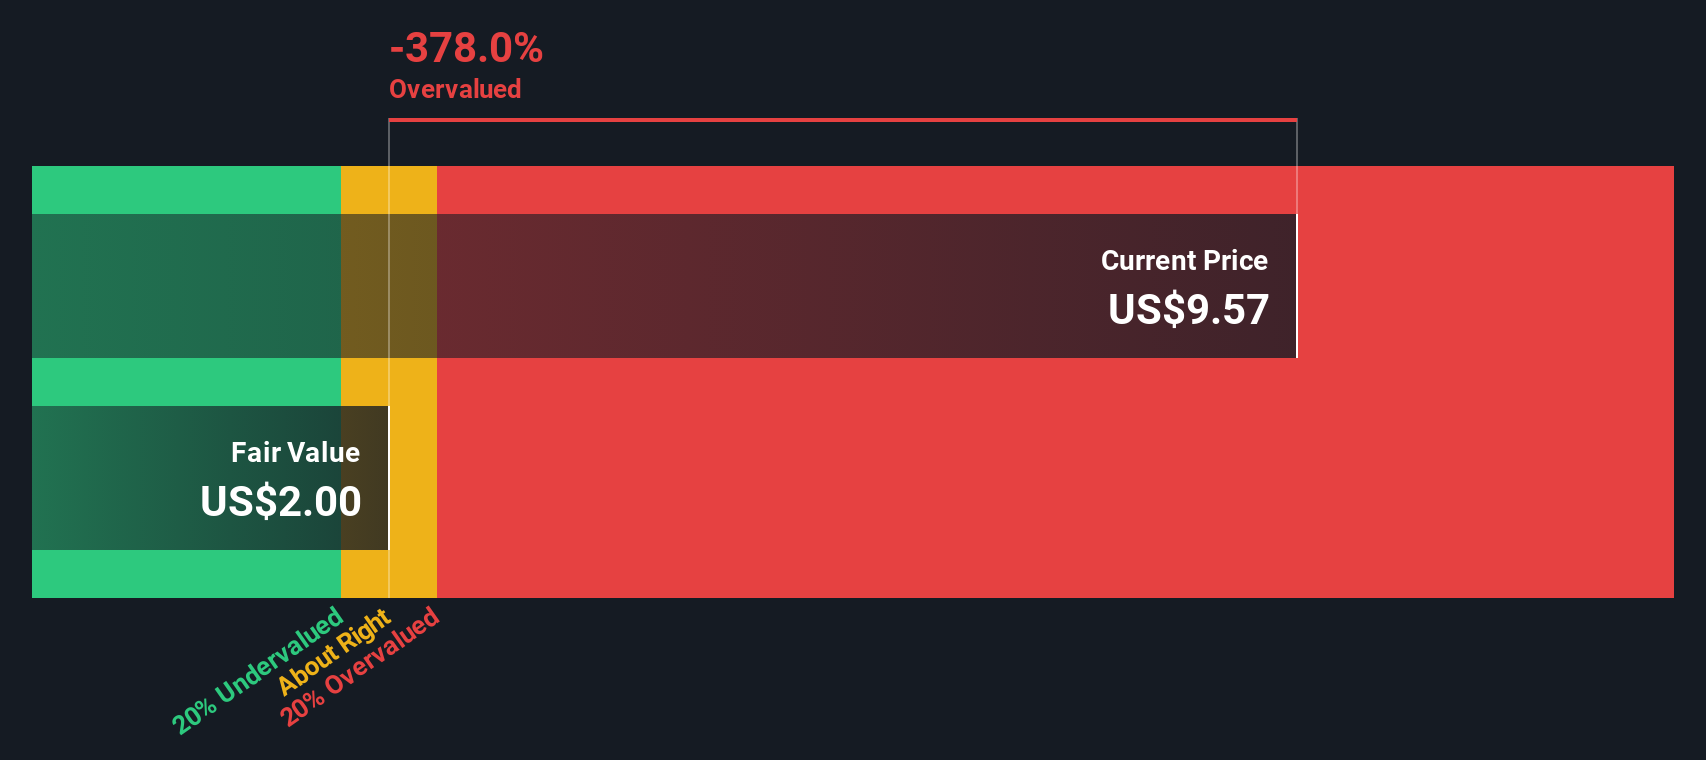
While the 1.7x P/S ratio points to good value, our DCF model tells a different story. On that view, FNMA at about $8.19 is trading well above an estimated future cash flow value of around $2, which frames the stock as expensive on cash flow assumptions.
That gap can matter in practice, because it raises the question of whether the market is overestimating future cash generation or whether the model is too conservative. If you rely on cash flows more than sales, which signal do you treat as more important?
Simply Wall St performs a discounted cash flow (DCF) on every stock in the world every day (check out Federal National Mortgage Association for example). We show the entire calculation in full. You can track the result in your watchlist or portfolio and be alerted when this changes, or use our stock screener to discover 875 undervalued stocks based on their cash flows. If you save a screener we even alert you when new companies match - so you never miss a potential opportunity.
If this take does not quite match your view, or you prefer to work through the data yourself, you can build a personalised thesis in minutes with Do it your way.
A great starting point for your Federal National Mortgage Association research is our analysis highlighting 1 key reward and 2 important warning signs that could impact your investment decision.
If FNMA is on your radar, do not stop there. A few targeted stock screens can quickly surface other opportunities that might fit your style and risk comfort.
This article by Simply Wall St is general in nature. We provide commentary based on historical data and analyst forecasts only using an unbiased methodology and our articles are not intended to be financial advice. It does not constitute a recommendation to buy or sell any stock, and does not take account of your objectives, or your financial situation. We aim to bring you long-term focused analysis driven by fundamental data. Note that our analysis may not factor in the latest price-sensitive company announcements or qualitative material. Simply Wall St has no position in any stocks mentioned.
