
Please use a PC Browser to access Register-Tadawul
Get It
Assessing Immunome (IMNM) Valuation After Phase 3 Success And Upcoming J.P. Morgan Conference Presentation
Immunome, Inc. IMNM | 21.50 | -2.89% |
Immunome (IMNM) is back in focus after reporting successful Phase 3 data for its lead drug candidate, varegacestat, as well as plans to present at the upcoming J.P. Morgan Healthcare Conference, drawing fresh attention to the stock.
That backdrop helps explain why Immunome’s share price, now at $21.07, has seen a 90 day share price return of 51.36%, while the 1 year total shareholder return sits at 98.77%, suggesting momentum has been building around the story.
If this kind of biotech catalyst has your attention, it could be a good moment to scan other healthcare stocks that are catching interest in the sector.
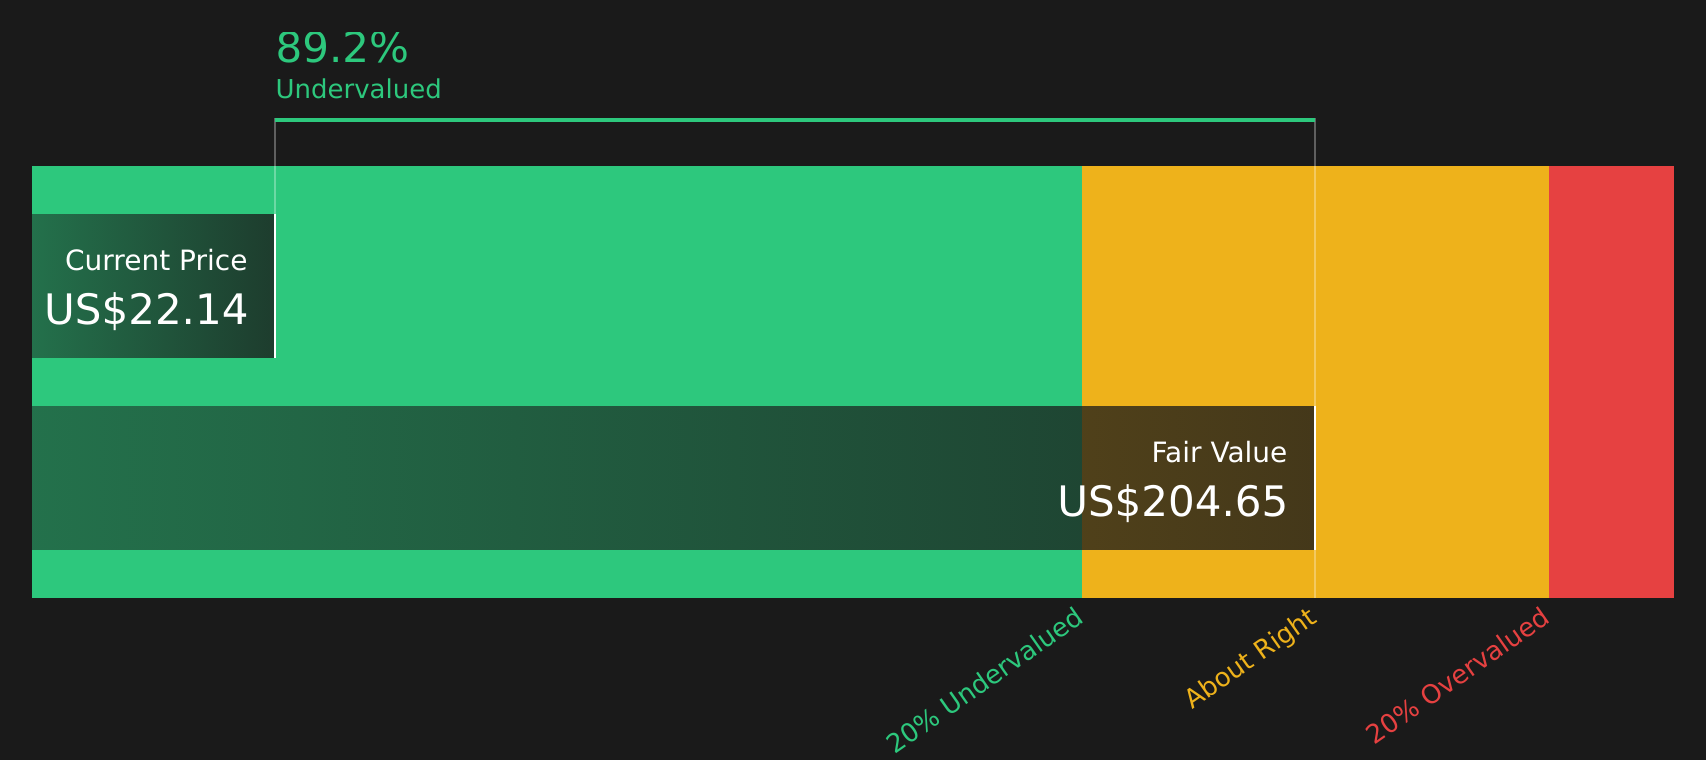
With the shares at $21.07, a large intrinsic discount flagged, and a price target of $34.50 on the table, the key question is simple: Is Immunome still underappreciated, or is the market already pricing in future growth?
On our numbers, Immunome screens as expensive on a P/B of 8.8x at a share price of $21.07, especially when compared with peers.
P/B compares the market value of the equity to the accounting book value. This can be a useful shorthand in early stage or unprofitable biotech names where earnings are not a reliable anchor.
The key point here is that the market is paying a much richer multiple of Immunome’s net assets, even though the company is still reporting losses and is not expected to reach profitability within the next three years.
Relative to the US Biotechs industry average P/B of 2.7x and a peer average of 6.7x, Immunome’s 8.8x stands out as materially higher. This implies investors are accepting a premium valuation compared to both the broader group and closer comparables.
Result: Price-to-book of 8.8x (OVERVALUED)
However, the story still carries risks, including ongoing losses, with net income at a loss of US$222.743 million, and heavy reliance on successful clinical outcomes.
The P/B of 8.8x presents Immunome as expensive, but our DCF model indicates something very different. At a share price of $21.07, the SWS DCF model estimates fair value at $131.20, which implies the stock is trading at a large discount instead of a premium.
This type of gap between a balance-sheet-based metric and a cash flow model raises a simple question for you as an investor: is the DCF too optimistic about future cash generation, or is the market too focused on current losses and headline multiples?
Simply Wall St performs a discounted cash flow (DCF) on every stock in the world every day (check out Immunome for example). We show the entire calculation in full. You can track the result in your watchlist or portfolio and be alerted when this changes, or use our stock screener to discover 879 undervalued stocks based on their cash flows. If you save a screener we even alert you when new companies match - so you never miss a potential opportunity.
If you interpret the numbers differently or want to test these assumptions yourself, you can build your own view in minutes by starting with Do it your way.
A great starting point for your Immunome research is our analysis highlighting 3 key rewards and 3 important warning signs that could impact your investment decision.
If Immunome has you thinking more broadly about opportunities, do not stop here. Use this momentum to line up your next set of ideas with focus.
This article by Simply Wall St is general in nature. We provide commentary based on historical data and analyst forecasts only using an unbiased methodology and our articles are not intended to be financial advice. It does not constitute a recommendation to buy or sell any stock, and does not take account of your objectives, or your financial situation. We aim to bring you long-term focused analysis driven by fundamental data. Note that our analysis may not factor in the latest price-sensitive company announcements or qualitative material. Simply Wall St has no position in any stocks mentioned.
