
Please use a PC Browser to access Register-Tadawul
Get It
Assessing Janus Henderson Group (NYSE:JHG) Valuation After Recent Share Price Momentum
Janus Henderson Group PLC JHG | 50.20 | +2.37% |
Janus Henderson Group (JHG) has drawn attention after its recent share performance, with a 1 day return close to flat and total returns of about 10% over the past 3 months.
For context, the stock closed at $48.22, with trailing 1 year and 3 year total returns of roughly 16% and very large levels respectively, while the value score currently sits at 3.
The recent 90 day share price return of 10.22% suggests positive momentum has been building, while the 3 year and 5 year total shareholder returns above 90% indicate a strong longer term payoff for investors who stayed invested.
If this kind of steady compounding interests you, it could be a good moment to broaden your watchlist and check out our screener of 22 top founder-led companies.
So with Janus Henderson trading near $48 and only about 4% below the average analyst price target, as well as an intrinsic value premium of roughly 25%, is there still a buying opportunity here, or is future growth already priced in?
At $48.22, Janus Henderson Group sits slightly below the most widely followed fair value estimate of about $50.14 per share, setting the scene for a valuation built on detailed growth, margin and discount rate assumptions.
Expanding and innovating in active fixed income ETFs and tokenized funds positions the firm to benefit from rising demand for differentiated, outcome-oriented, and technology-enabled investment solutions. This directly drives revenue and helps maintain or improve net margins in a fee-compressed environment.
Curious what has to happen in revenues, margins and future earnings multiples to support that price? The narrative leans on specific growth paths and falling required returns. The numbers behind that story may surprise you.
Result: Fair Value of $50.14 (UNDERVALUED)
However, that story could unravel if client outflows persist, or if fee compression and rising expenses squeeze margins more than analysts currently factor in.
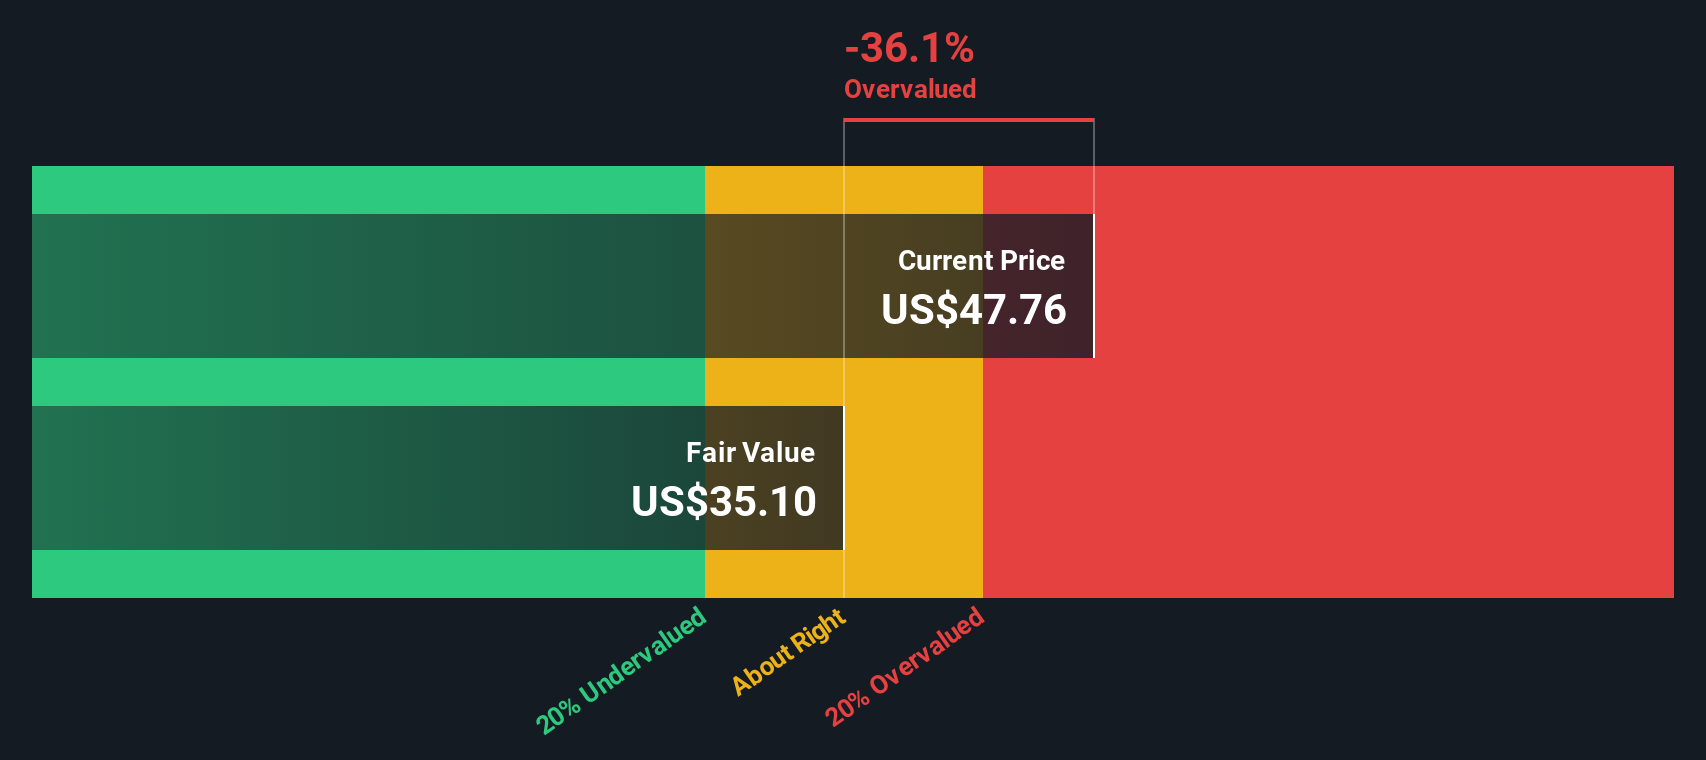
The fair value story changes when you look at our DCF model. On that basis, Janus Henderson’s estimated future cash flow value sits at about $38.68 per share, with the current $48.22 price implying roughly a 25% premium rather than a discount. Which lens do you trust more for your own thesis?
Simply Wall St performs a discounted cash flow (DCF) on every stock in the world every day (check out Janus Henderson Group for example). We show the entire calculation in full. You can track the result in your watchlist or portfolio and be alerted when this changes, or use our stock screener to discover 51 high quality undervalued stocks. If you save a screener we even alert you when new companies match - so you never miss a potential opportunity.
If you see the assumptions differently or want to stress test the data yourself, you can build a personalized thesis in just a few minutes, starting with Do it your way.
A great starting point for your Janus Henderson Group research is our analysis highlighting 3 key rewards and 1 important warning sign that could impact your investment decision.
If you are weighing up Janus Henderson today, it is a good time to widen your field of view and line up a few strong alternatives on your watchlist.
This article by Simply Wall St is general in nature. We provide commentary based on historical data and analyst forecasts only using an unbiased methodology and our articles are not intended to be financial advice. It does not constitute a recommendation to buy or sell any stock, and does not take account of your objectives, or your financial situation. We aim to bring you long-term focused analysis driven by fundamental data. Note that our analysis may not factor in the latest price-sensitive company announcements or qualitative material. Simply Wall St has no position in any stocks mentioned.
