
Please use a PC Browser to access Register-Tadawul
Get It
Assessing Molina Healthcare (MOH) Valuation As Management Outlines A 12 To 24 Month Improvement Plan
Molina Healthcare, Inc. MOH | 181.18 | +0.89% |
Molina Healthcare (MOH) is drawing fresh attention after management outlined a 12 to 24 month roadmap centered on premium adjustments, contract seasoning, solid earnings, positive cash flow, and ongoing share buybacks.
The recent 21.2% 1 month share price return and 21.7% 3 month share price return to US$198.75 suggests momentum is picking up again, even though the 1 year total shareholder return of a 35.1% decline and 5 year total shareholder return of a 9.0% decline show a tougher longer term picture.
If Molina’s reset has you reassessing healthcare, it could be a good moment to broaden your watchlist with healthcare stocks as potential comparison ideas.
With MOH trading at US$198.75, well above the average analyst price target of US$186.69 yet flagged with a strong intrinsic discount score, the key question is whether there is still a buying opportunity or if markets are already pricing in future growth.
At US$198.75, Molina Healthcare trades on a P/E of 11.6x, which screens as inexpensive compared to both its peers and the broader US healthcare sector.
P/E looks at what you are paying today for each dollar of earnings. This is especially relevant for a company like Molina that is profitable and already generating US$883m of net income on US$42.8b of revenue.
Here, the market is valuing Molina at a clear discount. The 11.6x P/E sits well below the US healthcare industry average of 23.6x, and also below the peer group average of 29.1x. Against an estimated fair P/E of 23.6x, the current multiple suggests plenty of room for the valuation to move closer to levels that similar businesses command.
Result: Price-to-Earnings of 11.6x (UNDERVALUED)
However, you still need to weigh policy or reimbursement changes to Medicaid and Medicare, as well as any shift in managed care contracts, which could challenge this valuation story.
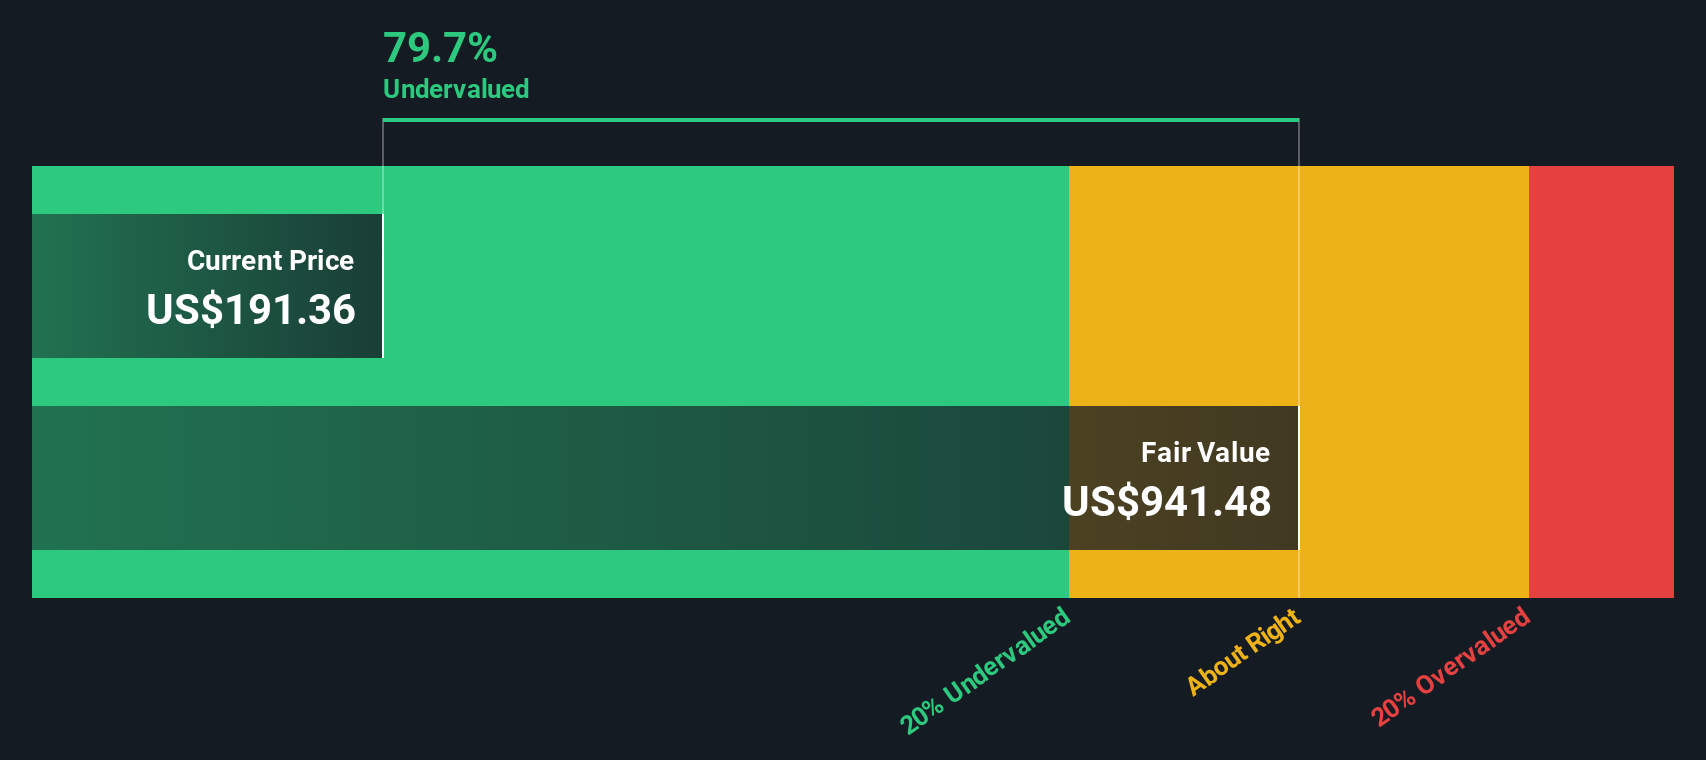
While the 11.6x P/E points to a low valuation, our DCF model presents an even starker picture, with Molina Healthcare at US$198.75 versus an estimated future cash flow value of US$788.79. That is a very large gap, so is the market missing something or is the model too optimistic?
Simply Wall St performs a discounted cash flow (DCF) on every stock in the world every day (check out Molina Healthcare for example). We show the entire calculation in full. You can track the result in your watchlist or portfolio and be alerted when this changes, or use our stock screener to discover 878 undervalued stocks based on their cash flows. If you save a screener we even alert you when new companies match - so you never miss a potential opportunity.
If you see the numbers differently or prefer to test your own assumptions, you can build a full Molina view in just a few minutes by starting with Do it your way.
A great starting point for your Molina Healthcare research is our analysis highlighting 3 key rewards and 1 important warning sign that could impact your investment decision.
If Molina has you rethinking your portfolio, do not stop here, broaden your opportunity set now so you do not miss what could be next.
This article by Simply Wall St is general in nature. We provide commentary based on historical data and analyst forecasts only using an unbiased methodology and our articles are not intended to be financial advice. It does not constitute a recommendation to buy or sell any stock, and does not take account of your objectives, or your financial situation. We aim to bring you long-term focused analysis driven by fundamental data. Note that our analysis may not factor in the latest price-sensitive company announcements or qualitative material. Simply Wall St has no position in any stocks mentioned.
