
Please use a PC Browser to access Register-Tadawul
Get It
Assessing Rhythm Pharmaceuticals (RYTM) Valuation After Recent Share Price Weakness
Rhythm Pharmaceuticals, Inc. RYTM | 99.78 | -3.28% |
Rhythm Pharmaceuticals (RYTM) has drawn attention after recent share price weakness, with the stock down about 11% over the past month and roughly 3% over the past 3 months, despite a strong 1 year total return.
For investors tracking this rare disease biopharma name, that mix of shorter term pullback alongside longer term gains is prompting fresh interest in how the company’s fundamentals and risk profile compare at current levels.
At around $96.06, Rhythm’s recent share price returns show fading momentum in the short term, yet the 1 year and multi year total shareholder returns still point to a very strong overall journey for longer term holders.
If this rare disease story has caught your eye, it might be a good moment to see what else is moving in healthcare by checking out 24 healthcare AI stocks as another set of ideas.
So with Rhythm posting strong multi year total returns, fast revenue growth and a current share price well below some valuation estimates, should you see recent weakness as a fresh entry point or assume the market is already pricing in future growth?
Rhythm Pharmaceuticals’ most followed narrative pegs fair value at about $141.57 per share versus the last close at $96.06, which explains why some investors see the recent pullback as an opportunity rather than a warning sign.
Upcoming potential regulatory approvals and launches for setmelanotide (IMCIVREE) in new indications like acquired hypothalamic obesity and Prader Willi syndrome, alongside expansion into younger age groups, are expected to materially grow Rhythm's commercial opportunity and topline over the next several years.
Curious how that kind of expansion supports a higher fair value? The narrative leans heavily on aggressive revenue compounding, sharp margin improvement, and a richer future earnings multiple. The full story joins those assumptions with a specific discount rate to land on that $141.57 figure.
Result: Fair Value of $141.57 (UNDERVALUED)
However, you still need to weigh heavy ongoing losses and Rhythm’s reliance on IMCIVREE, because setbacks in this area could quickly challenge those upbeat growth assumptions.
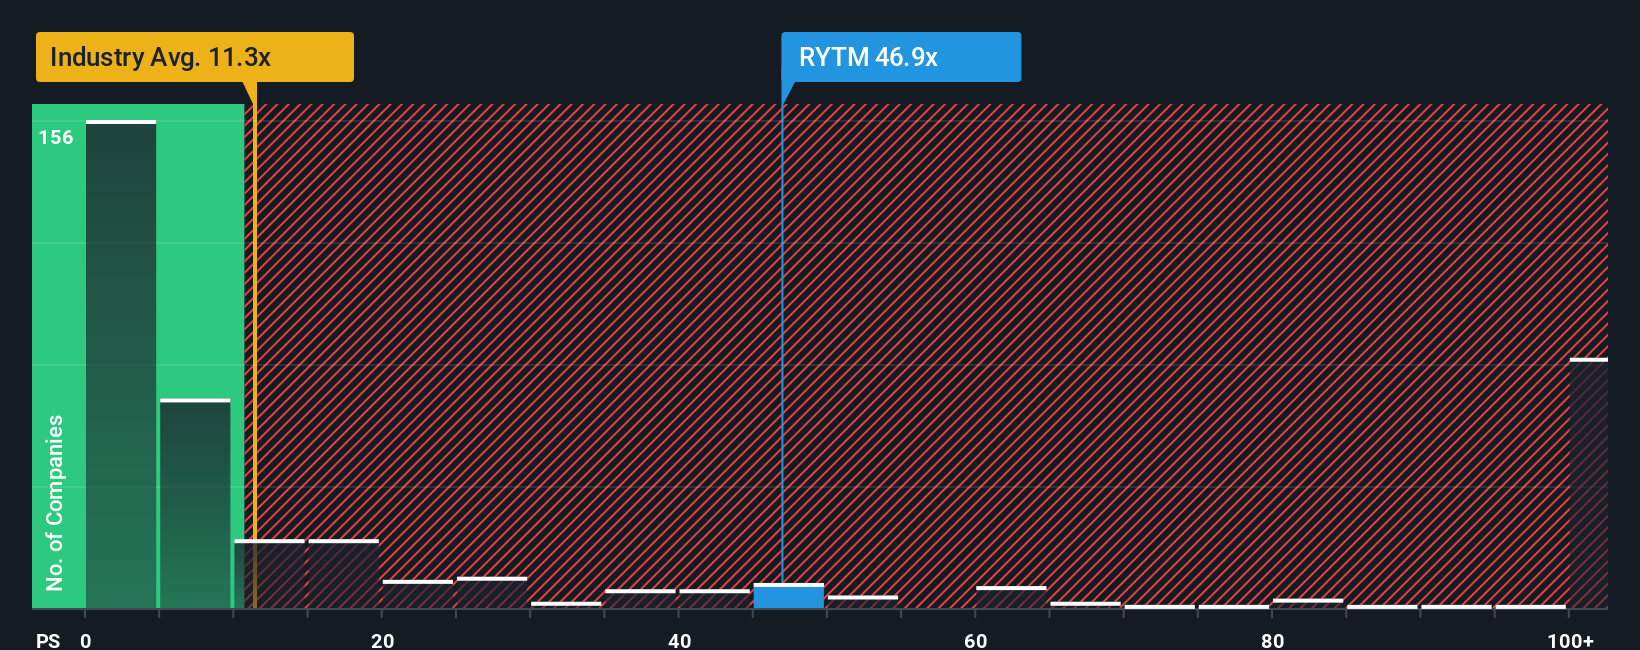
The earlier view leans on cash flow and long term compounding, but the simple revenue multiple tells a different story. Rhythm trades on a P/S of 36.8x, which is far richer than the US Biotechs average of 11.6x, the peer average of 21.7x, and the fair ratio of 20.9x that the market could eventually move toward.
That kind of gap can work both ways. It can reward you if growth expectations hold up, or hurt quickly if sentiment shifts and the P/S drifts closer to that fair ratio or industry levels. Which scenario feels more realistic to you at today’s price?
If you see the story differently or prefer to test the assumptions yourself, you can build a custom Rhythm view in minutes using Do it your way.
A good starting point is our analysis highlighting 3 key rewards investors are optimistic about regarding Rhythm Pharmaceuticals.
If Rhythm feels interesting but you want a fuller watchlist, now is the time to line up a few more high quality ideas worth monitoring closely.
This article by Simply Wall St is general in nature. We provide commentary based on historical data and analyst forecasts only using an unbiased methodology and our articles are not intended to be financial advice. It does not constitute a recommendation to buy or sell any stock, and does not take account of your objectives, or your financial situation. We aim to bring you long-term focused analysis driven by fundamental data. Note that our analysis may not factor in the latest price-sensitive company announcements or qualitative material. Simply Wall St has no position in any stocks mentioned.
