
Please use a PC Browser to access Register-Tadawul
Get It
Assessing SIGA Technologies (SIGA) Valuation As Biodefense Strength Draws Renewed Investor Attention
SIGA Technologies Inc SIGA | 6.53 | -2.54% |
SIGA Technologies (SIGA) is drawing fresh attention after recent coverage highlighted its TPOXX smallpox antiviral, consistent profitability, and solid balance sheet, even as major new contract or regulatory announcements remain quiet.
At a share price of US$6.77, SIGA has seen a 10.8% 7 day share price return and an 8.3% 30 day share price return, while its 1 year total shareholder return of 19.1% points to momentum that has picked up recently after weaker 90 day price performance.
If SIGA’s recent move has you thinking more broadly about healthcare defensives, it could be a good time to scan other healthcare stocks that might fit your watchlist.
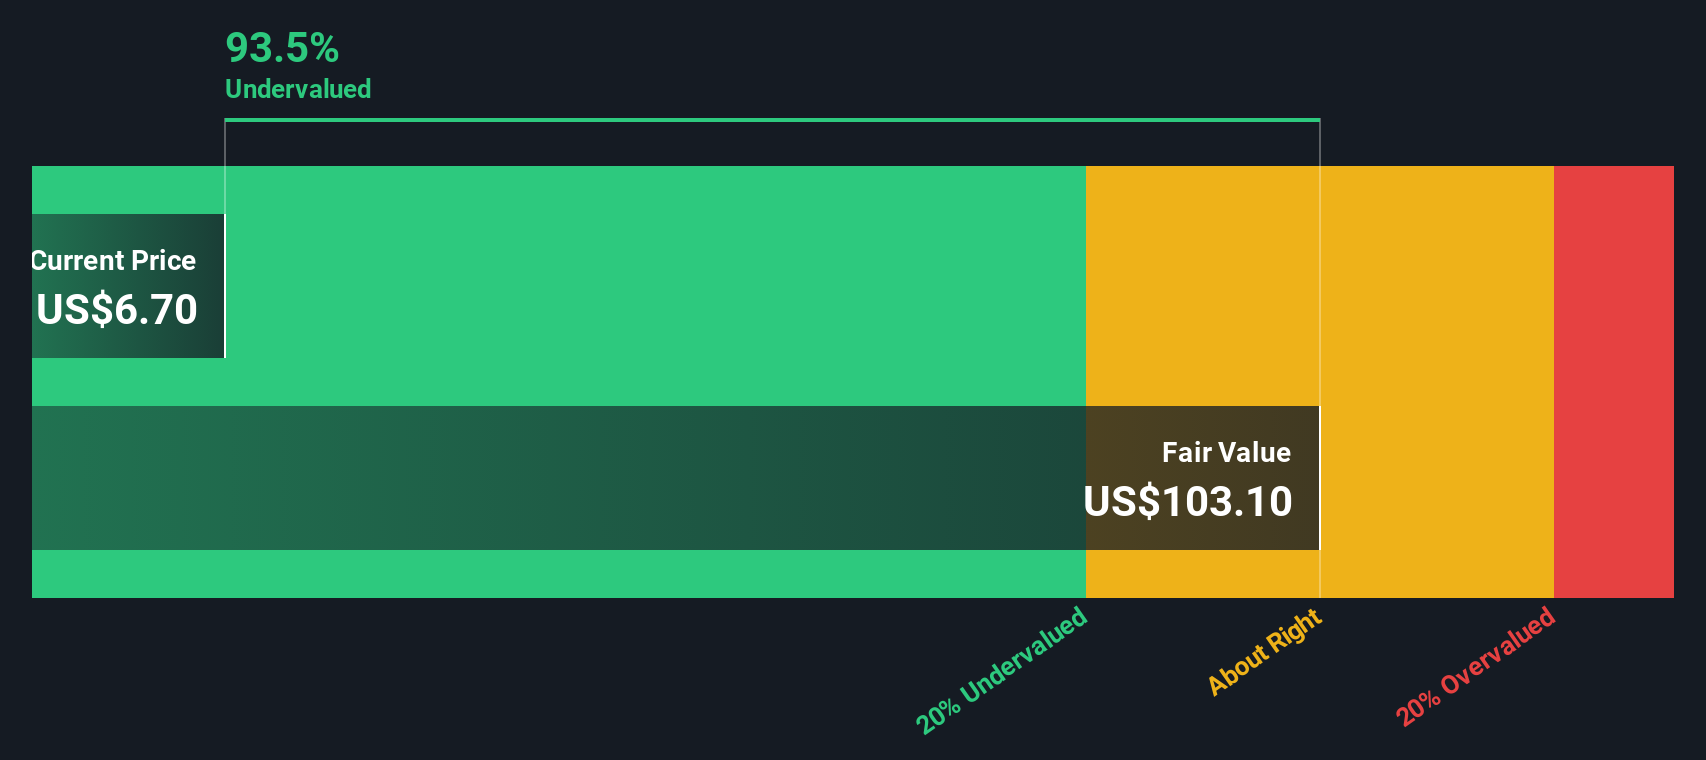
Between a value score of 5, an indicated intrinsic discount of about 93%, and mixed recent returns, SIGA looks like a classic debate stock. Is this genuine undervaluation, or is the market already baking in its future growth?
At a last close of US$6.77, SIGA trades on a P/E of 6.5x, which points to a low earnings multiple compared to both peers and the broader US pharmaceuticals group.
The P/E ratio compares the current share price with earnings per share. It effectively shows how much investors are paying for each dollar of current profit. For a commercial stage pharmaceutical company like SIGA, this can be a useful shorthand for how the market is weighing its established profitability against expectations for future growth.
Here, the stated fair P/E of 28.2x is far above the current 6.5x. This suggests the market is assigning a much lower earnings multiple than that fair ratio level could support. The same pattern appears against the peer average P/E of 33.2x and the wider US pharmaceuticals industry at 19.7x, which are all well above SIGA's current multiple.
Result: Price-to-Earnings of 6.5x (UNDERVALUED)
However, you still need to weigh concentration in a single product and the recent 17.6% 90 day share price decline as potential pressure points.
While the 6.5x P/E makes SIGA look cheap, our DCF model points in the same direction but on a much stronger scale, with an estimated fair value of about US$99.60 per share versus the current US$6.77. That gap suggests investors need to think hard about what the market might be missing, or what the model could be assuming.
Simply Wall St performs a discounted cash flow (DCF) on every stock in the world every day (check out SIGA Technologies for example). We show the entire calculation in full. You can track the result in your watchlist or portfolio and be alerted when this changes, or use our stock screener to discover 879 undervalued stocks based on their cash flows. If you save a screener we even alert you when new companies match - so you never miss a potential opportunity.
If you see the numbers differently or prefer to test your own assumptions, you can access the same data and build a custom thesis in a few minutes, then Do it your way.
A good starting point is our analysis highlighting 3 key rewards investors are optimistic about regarding SIGA Technologies.
If SIGA has sharpened your interest, do not stop here. The broader market is packed with other angles that could round out your watchlist and spark fresh thinking.
This article by Simply Wall St is general in nature. We provide commentary based on historical data and analyst forecasts only using an unbiased methodology and our articles are not intended to be financial advice. It does not constitute a recommendation to buy or sell any stock, and does not take account of your objectives, or your financial situation. We aim to bring you long-term focused analysis driven by fundamental data. Note that our analysis may not factor in the latest price-sensitive company announcements or qualitative material. Simply Wall St has no position in any stocks mentioned.
