
Please use a PC Browser to access Register-Tadawul
Get It
Assessing UiPath’s Valuation After 11% Surge and Strong 2025 Growth Outlook
UiPath, Inc. PATH | 17.42 17.64 | -3.38% +1.26% Pre |
If you’re staring at UiPath’s ticker and wondering whether to buy, hold, or walk away, you’re definitely not alone. The stock has pulled off some dramatic moves lately, and it’s giving investors and onlookers plenty to talk about. Just over the past seven days, UiPath jumped an impressive 11.2%, and that surge comes on the heels of a 44.6% climb in the last month. Year to date, the stock is up 27.5%, with a 28.0% gain over the last year. Looking at a three-year view, shares have risen 34.4%, hinting at real growth potential and suggesting the market’s appetite for risk is shifting.
What’s changed to send UiPath on this recent run? There has been increased attention on automation and AI solutions across industries, and UiPath’s role as a major player has not gone unnoticed. Some market watchers see shifts in industry sentiment as the main driver for the latest rally.
All this price action brings us to the important question: is UiPath undervalued right now, or has the market gotten ahead of itself? To help answer that, we can look at some tried-and-true valuation checks. UiPath scores a 3 out of 6 on our valuation scorecard, suggesting it may be undervalued in certain areas but not across the board. Let’s break down what those numbers really mean using several different approaches to valuation, and before we wrap up, I’ll share an even more insightful way to look at UiPath’s true worth.
The Discounted Cash Flow (DCF) model estimates a company’s value by projecting its future cash flows and discounting them back to their present value. This approach attempts to capture the company’s true earning power over time by focusing on the cash it’s expected to generate.
UiPath currently produces free cash flow (FCF) of about $318.9 million. Based on analyst forecasts and Simply Wall St extrapolations, this figure is projected to grow steadily, reaching approximately $700.8 million by 2035. While analysts only provide detailed projections for the next few years, later numbers rely on reasonable growth assumptions consistent with industry trends.
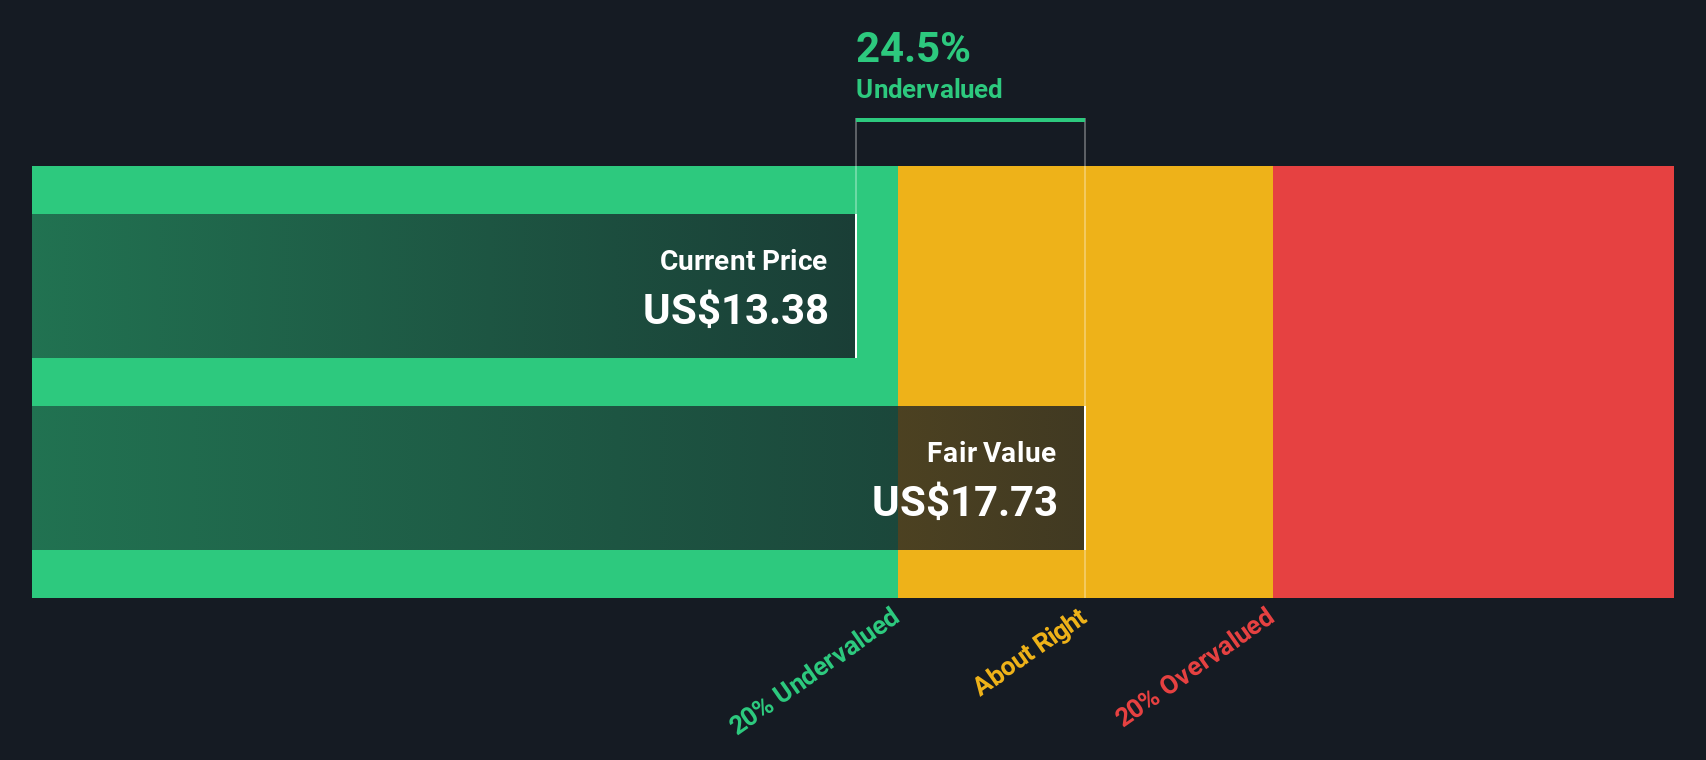
All projections and calculations are reported in US Dollars. The DCF model for UiPath suggests a fair value of $17.85 per share. That price comes with a discount of 7.7% compared to the current share price. This suggests the stock is essentially trading at about what it’s worth right now.
Result: ABOUT RIGHT
Simply Wall St performs a valuation analysis on every stock in the world every day (check out UiPath's valuation analysis). We show the entire calculation in full. You can track the result in your watchlist or portfolio and be alerted when this changes.
For many companies undergoing rapid growth but not yet showing substantial profits, the Price-to-Sales (P/S) ratio is a sensible and widely used valuation metric. It offers a way to weigh the market’s expectations for revenue expansion, especially when earnings may not fully reflect the underlying momentum or long-term potential of a company like UiPath.
What is considered a “normal” or “fair” P/S ratio depends a lot on how quickly sales are growing and how risky the underlying business is perceived to be. Higher expected growth and lower risk tend to justify higher ratios, while slow growth or greater uncertainty typically result in lower multiples.
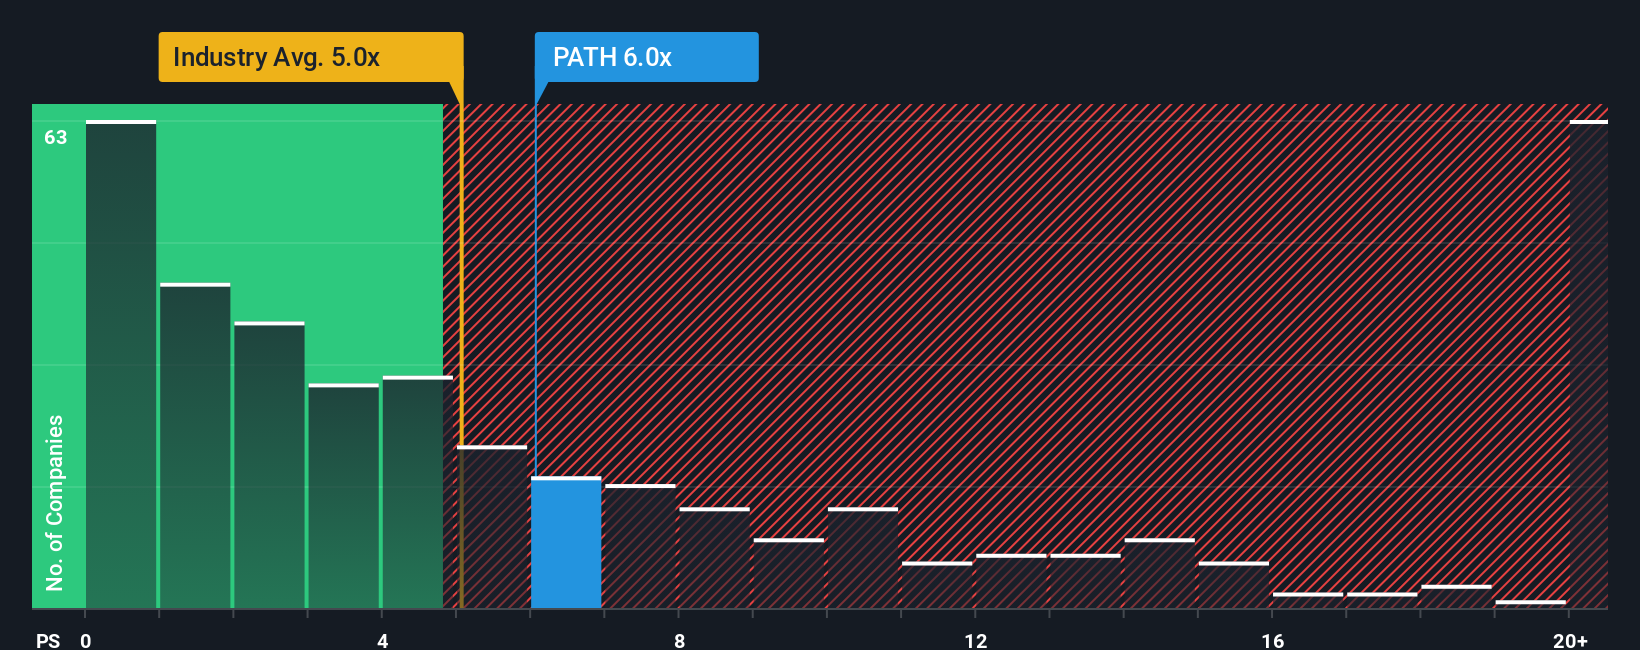
UiPath currently trades at a P/S ratio of 5.85x, which is just above the software industry average of 5.19x and well below the peer group average of 10.40x. However, these benchmarks can be blunt tools as they may overlook unique factors shaping UiPath’s earnings potential.
This is where the Simply Wall St Fair Ratio comes in. The Fair Ratio for UiPath, sitting at 7.07x, reflects a tailored view that considers UiPath’s own growth outlook, industry, profit margins, company size and risk profile. This approach gives a more nuanced assessment than either blanket industry averages or peer comparisons alone.
UiPath’s actual P/S ratio is slightly lower than its Fair Ratio, indicating the shares are trading very close to what would be considered “about right” given the fundamentals and outlook.
Result: ABOUT RIGHT
PS ratios tell one story, but what if the real opportunity lies elsewhere? Discover companies where insiders are betting big on explosive growth.
Earlier, we mentioned there’s a more insightful way to understand valuation than any single number, so let’s introduce you to Narratives, an approach that helps investors go beyond formulas by combining your story or expectations about a company (such as fair value, future revenues, earnings, and margins) with concrete financial forecasts.
A Narrative is simply your unique perspective on what will drive a company’s performance and how its story unfolds, all anchored to real projections and an estimated fair value. Narratives link each company’s journey to a financial outlook, making it easier to see if your views truly justify today’s price.
This tool is available on Simply Wall St’s Community page, where millions of investors shape and share their own Narratives. Narratives are dynamic and update in real time as new news or earnings reports emerge, so your fair value comparison is always based on the latest facts.
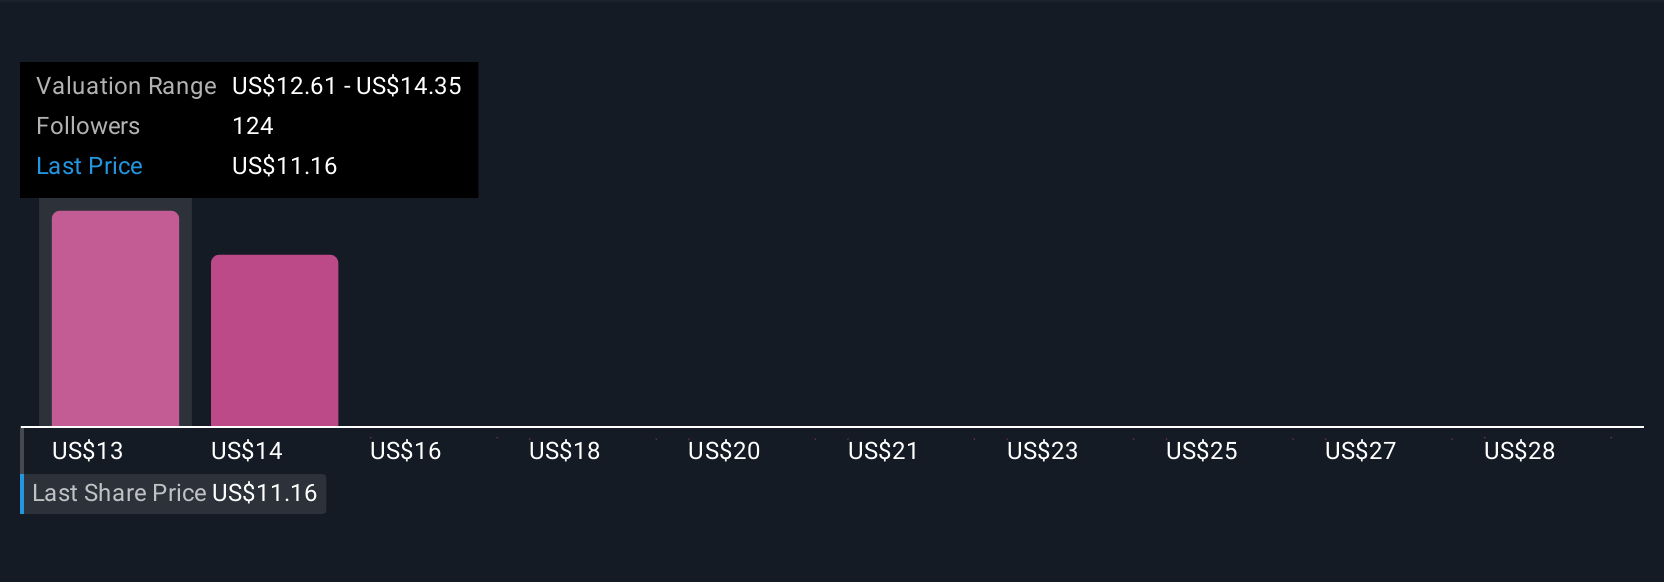
With Narratives, you quickly see the gap between what you believe a company like UiPath is worth and what the market is pricing in, giving you a clear basis to decide when to buy or sell. For example, the most bullish UiPath Narrative currently sets fair value at $17.00, while the most bearish pegs it at $11.71. This allows you to weigh your own expectations against a range of real-world perspectives.
Do you think there's more to the story for UiPath? Create your own Narrative to let the Community know!
This article by Simply Wall St is general in nature. We provide commentary based on historical data and analyst forecasts only using an unbiased methodology and our articles are not intended to be financial advice. It does not constitute a recommendation to buy or sell any stock, and does not take account of your objectives, or your financial situation. We aim to bring you long-term focused analysis driven by fundamental data. Note that our analysis may not factor in the latest price-sensitive company announcements or qualitative material. Simply Wall St has no position in any stocks mentioned.
