Baker Hughes (BKR) Margin Compression To 9.3% Tests Bullish Growth Narratives
Baker Hughes Company Class A BKR | 60.38 | +0.07% |
Baker Hughes (BKR) closed FY 2025 with fourth quarter revenue of US$7.4b and basic EPS of US$0.89, alongside net income of US$876m, setting a clear marker for how the year finished. The company reported quarterly revenue of US$7.0b in Q3 2025 and US$6.9b in Q2 2025, rising to US$7.4b in Q4 2025. Basic EPS moved from US$0.41 in Q1 to US$0.62 in Q3 and US$0.89 in Q4, giving investors a more detailed view of how profitability contributed to the current trailing year margins profile.
See our full analysis for Baker Hughes.With the headline numbers on the table, the next step is to compare these results with the widely followed narratives about Baker Hughes to identify which views the latest margin profile reflects and which ones the data calls into question.
9.3% Margin Versus 10.7% Last Year
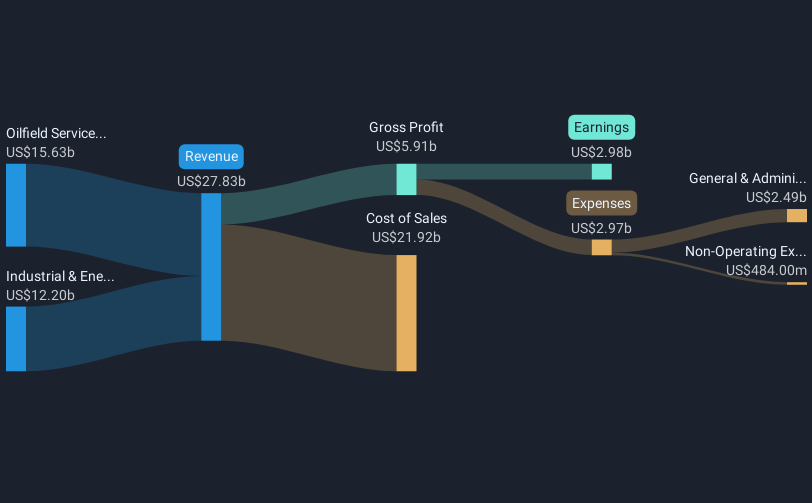
- Trailing net margin sits at 9.3% compared with 10.7% a year earlier, alongside trailing net income of US$2.6b on US$27.7b of revenue.
- Critics highlight that this weaker margin profile challenges a purely bullish view, even with trailing twelve month earnings of US$2.6b and Basic EPS of US$2.62, because:
- Five year EPS growth averaged 72.1% per year, yet the most recent year showed negative earnings growth and a lower margin, which pulls against the earlier strong trajectory.
- The forecast earnings growth rate of about 5.7% per year is well below the US market forecast of 16.1% per year, so recent compression in profitability adds weight to bearish concerns about slower growth.
Forecast 5.7% Earnings Growth Pace
- Earnings are forecast to grow about 5.7% per year while revenue is projected to grow around 1.9% per year, both below broader US market forecasts of 16.1% and 10.6% respectively.
- What stands out for a more bullish take is the contrast between these forward numbers and the history of strong EPS expansion, because:
- Five year EPS growth of roughly 72.1% per year shows the company has previously scaled profits much faster than the current 5.7% forecast implies.
- Trailing twelve month revenue around US$27.7b and net income of about US$2.6b suggest the business is already operating at a sizeable base, which can make even mid single digit growth meaningful in absolute dollar terms.
DCF Fair Value Versus US$56.29 Price
- The shares trade at US$56.29 compared with a stated DCF fair value of US$62.84 and on a P/E of 21.5x versus 22.2x for the US Energy Services industry and roughly 21.2x for peers.
- Supporters of a more constructive stance point out that these numbers give some valuation cushion, yet the growth profile keeps expectations in check, because:
- The roughly 10.4% gap between the current price and the DCF fair value, together with a P/E slightly below the industry average, suggests the stock is not priced at a premium despite its profit scale.
- At the same time, revenue growth forecasts of 1.9% per year and earnings growth of about 5.7% per year are slower than the broader US market, which may limit how far the valuation can stretch without a change in the growth outlook.
Next Steps
Don't just look at this quarter; the real story is in the long-term trend. We've done an in-depth analysis on Baker Hughes's growth and its valuation to see if today's price is a bargain. Add the company to your watchlist or portfolio now so you don't miss the next big move.
See What Else Is Out There
Baker Hughes is working from a solid profit base, but slower forecast earnings and revenue growth than the broader US market may limit its appeal.
If that growth profile feels too restrained, shift your focus to CTA_SCREENER_STABLE_GROWTH, where you can quickly zero in on companies with more consistent expansion through different cycles.
This article by Simply Wall St is general in nature. We provide commentary based on historical data and analyst forecasts only using an unbiased methodology and our articles are not intended to be financial advice. It does not constitute a recommendation to buy or sell any stock, and does not take account of your objectives, or your financial situation. We aim to bring you long-term focused analysis driven by fundamental data. Note that our analysis may not factor in the latest price-sensitive company announcements or qualitative material. Simply Wall St has no position in any stocks mentioned.