Belden's FY 2025 Earnings Snapshot Sets the Stage for Narrative Shifts
Belden (BDC) just posted its FY 2025 third quarter numbers, with revenue of US$698.2 million and basic EPS of US$1.43, while trailing 12 month EPS came in at US$5.72 on revenue of US$2.7 billion. The company has seen revenue move from US$654.9 million in Q3 2024 to US$698.2 million in Q3 2025, with quarterly EPS shifting from US$1.32 to US$1.43 over the same periods, and trailing net income reaching US$228.0 million. With earnings up 27.6% over the last year and net profit margin at 8.6% versus 7.6% previously, investors now have a clearer view of how Belden is converting sales into profit and where margins are settling.
See our full analysis for Belden.
With the latest results on the table, the next step is to see how these margin and earnings trends line up with the key narratives around Belden, and where the numbers start to challenge the prevailing views.
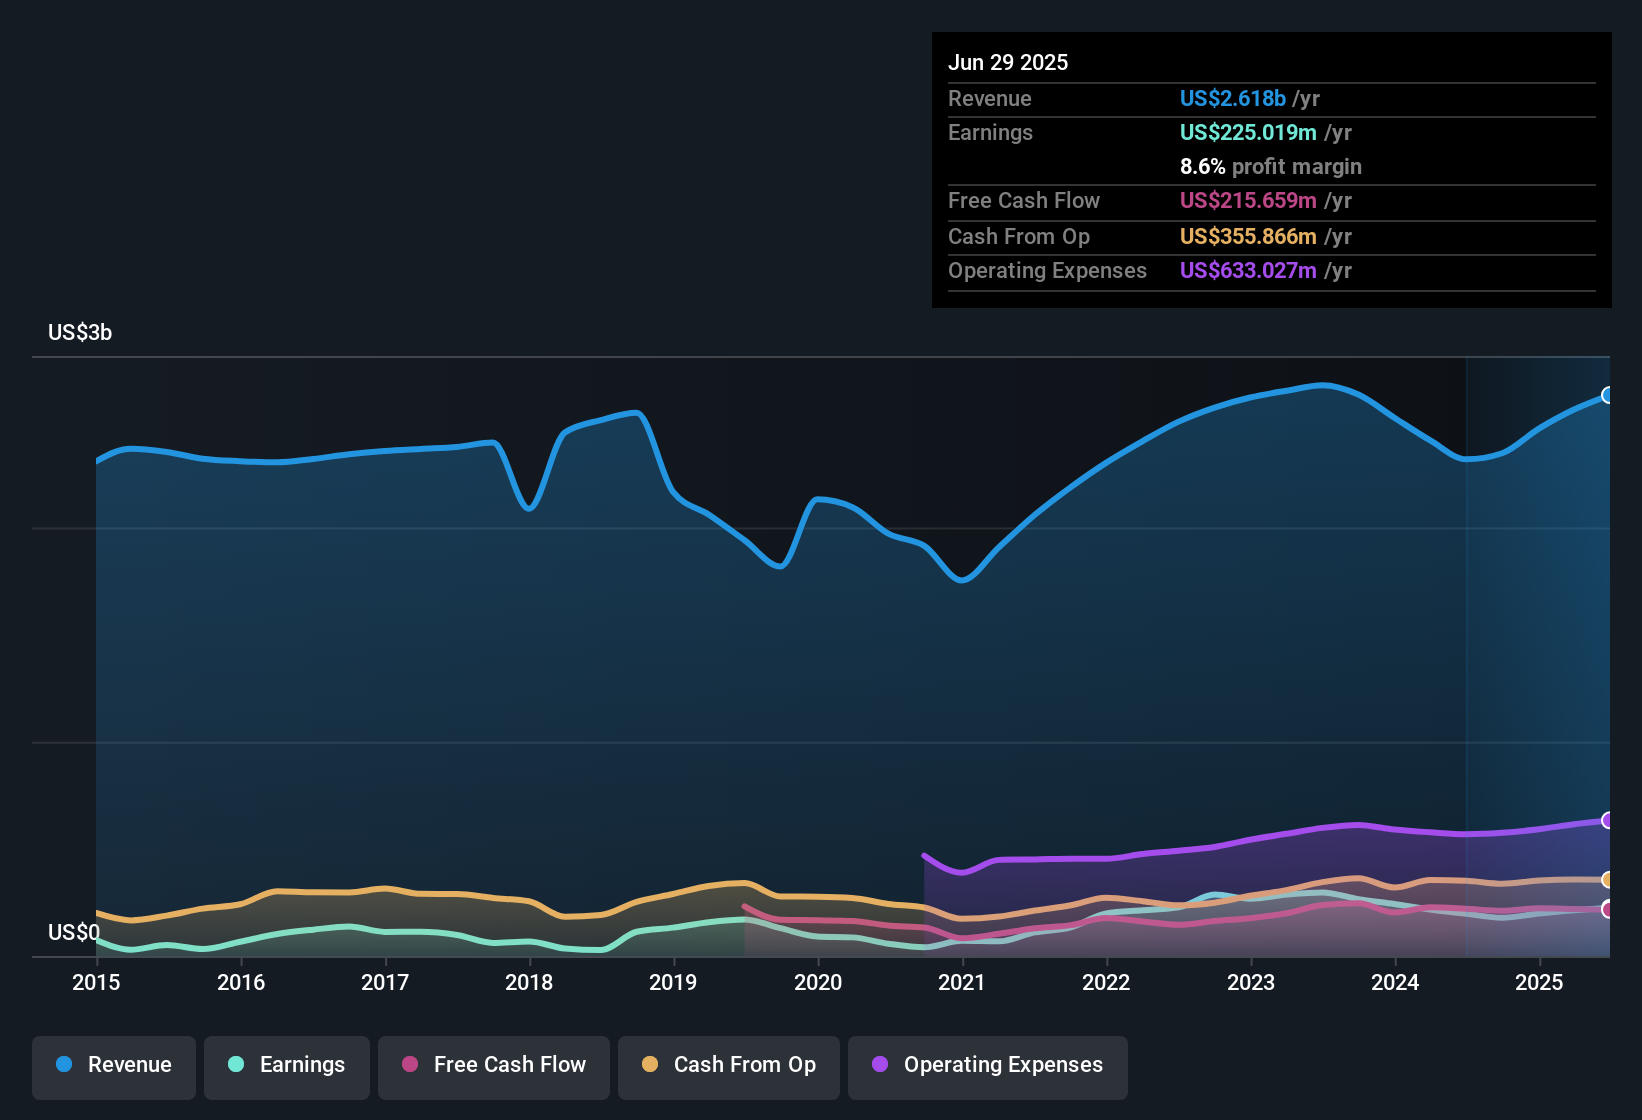
NYSE:BDC Earnings & Revenue History as at Feb 2026
8.6% Net Margin Backs Higher Earnings Quality Story
Over the last 12 months, Belden generated US$228.0 million in net income on US$2.7b of revenue, which works out to an 8.6% net profit margin compared with 7.6% in the prior year.
Consensus narrative talks about higher margins and earnings power from software and solutions, and the current 8.6% margin and 27.6% earnings growth over the last year both support that bullish idea, although:
Trailing EPS of US$5.72 and five year EPS growth of 10.8% per year show that the recent year was stronger than the longer term average, which lines up with the view that the mix is shifting toward higher value work.
At the same time, the need for ongoing investment in Smart Infrastructure and M&A that the consensus narrative highlights could keep margins sensitive to how well those projects convert into future revenue.
Quarterly EPS Holds Above US$1.40 While Revenue Nears US$700 Million
In FY 2025, Belden has reported Basic EPS of US$1.29, US$1.54 and US$1.43 across Q1, Q2 and Q3 respectively, alongside quarterly revenue between US$624.9 million and US$698.2 million, which keeps earnings per share above the US$1.20 level seen in Q2 2024.
Bulls argue that demand from digital transformation and network upgrades should support organic growth and higher value solutions, and the run of quarterly revenue from US$604.3 million in Q2 2024 to US$698.2 million in Q3 2025 fits that bullish angle, but:
The consensus narrative highlights multi year awards in hyperscale data centers and industrial automation, and the steady lift in trailing twelve month revenue from US$2.3b in Q2 2024 to US$2.7b in Q3 2025 lines up with that pipeline.
However, investors still need to watch how much of that growth comes with recurring, software like economics versus more traditional hardware, because only the overall margin, not the mix by segment, is visible in these figures.
If you want to see how the bullish case ties these EPS and revenue trends together, check the full argument in
🐂 Belden Bull Case
P/E Of 26x Versus 27.1x Industry And DCF At US$143.36
Belden is trading on a trailing P/E of 26x at a share price of US$150.91, compared with the US Electronic industry average of 27.1x and a peer average of 46.5x, while a DCF fair value of US$143.36 sits below the current price.
Bears point to valuation and leverage as watchpoints, and the fact that the share price is above the DCF fair value of US$143.36, alongside a note that the company has a high level of debt, fits that cautious view even though:
The 26x P/E is still below both the 27.1x industry average and the 46.5x peer average, which gives some relative support despite the absolute gap to DCF fair value.
Trailing earnings growth of 27.6% over the last year compared with a 10.8% five year average shows stronger recent profitability, so the key question for skeptics is how long that pace can be sustained given the balance sheet.
Skeptics who are focused on that P/E and DCF gap may want to see how the cautious case frames these risks in more detail in
🐻 Belden Bear Case
Next Steps
To see how these results tie into long-term growth, risks, and valuation, check out the full range of community narratives for Belden on Simply Wall St. Add the company to your watchlist or portfolio so you'll be alerted when the story evolves.
See the numbers differently? If this data points you in a new direction, shape your own view and build a full story in minutes with Do it your way
A great starting point for your Belden research is our analysis highlighting 2 key rewards and 2 important warning signs that could impact your investment decision.
See What Else Is Out There
Belden's use of high debt and a share price sitting above its DCF fair value leaves some investors uneasy about valuation and balance sheet risk.
If that combination makes you cautious about concentration in one name, compare it with companies highlighted in our solid balance sheet and fundamentals stocks screener (45 results) to put balance sheet strength front and center.
This article by Simply Wall St is general in nature. We provide commentary based on historical data and analyst forecasts only using an unbiased methodology and our articles are not intended to be financial advice. It does not constitute a recommendation to buy or sell any stock, and does not take account of your objectives, or your financial situation. We aim to bring you long-term focused analysis driven by fundamental data. Note that our analysis may not factor in the latest price-sensitive company announcements or qualitative material. Simply Wall St has no position in any stocks mentioned.