
Please use a PC Browser to access Register-Tadawul
Get It
Blackbaud (BLKB) Profit Turnaround Challenges Narratives Around Trailing Losses
Blackbaud, Inc. BLKB | 49.13 | -0.39% |
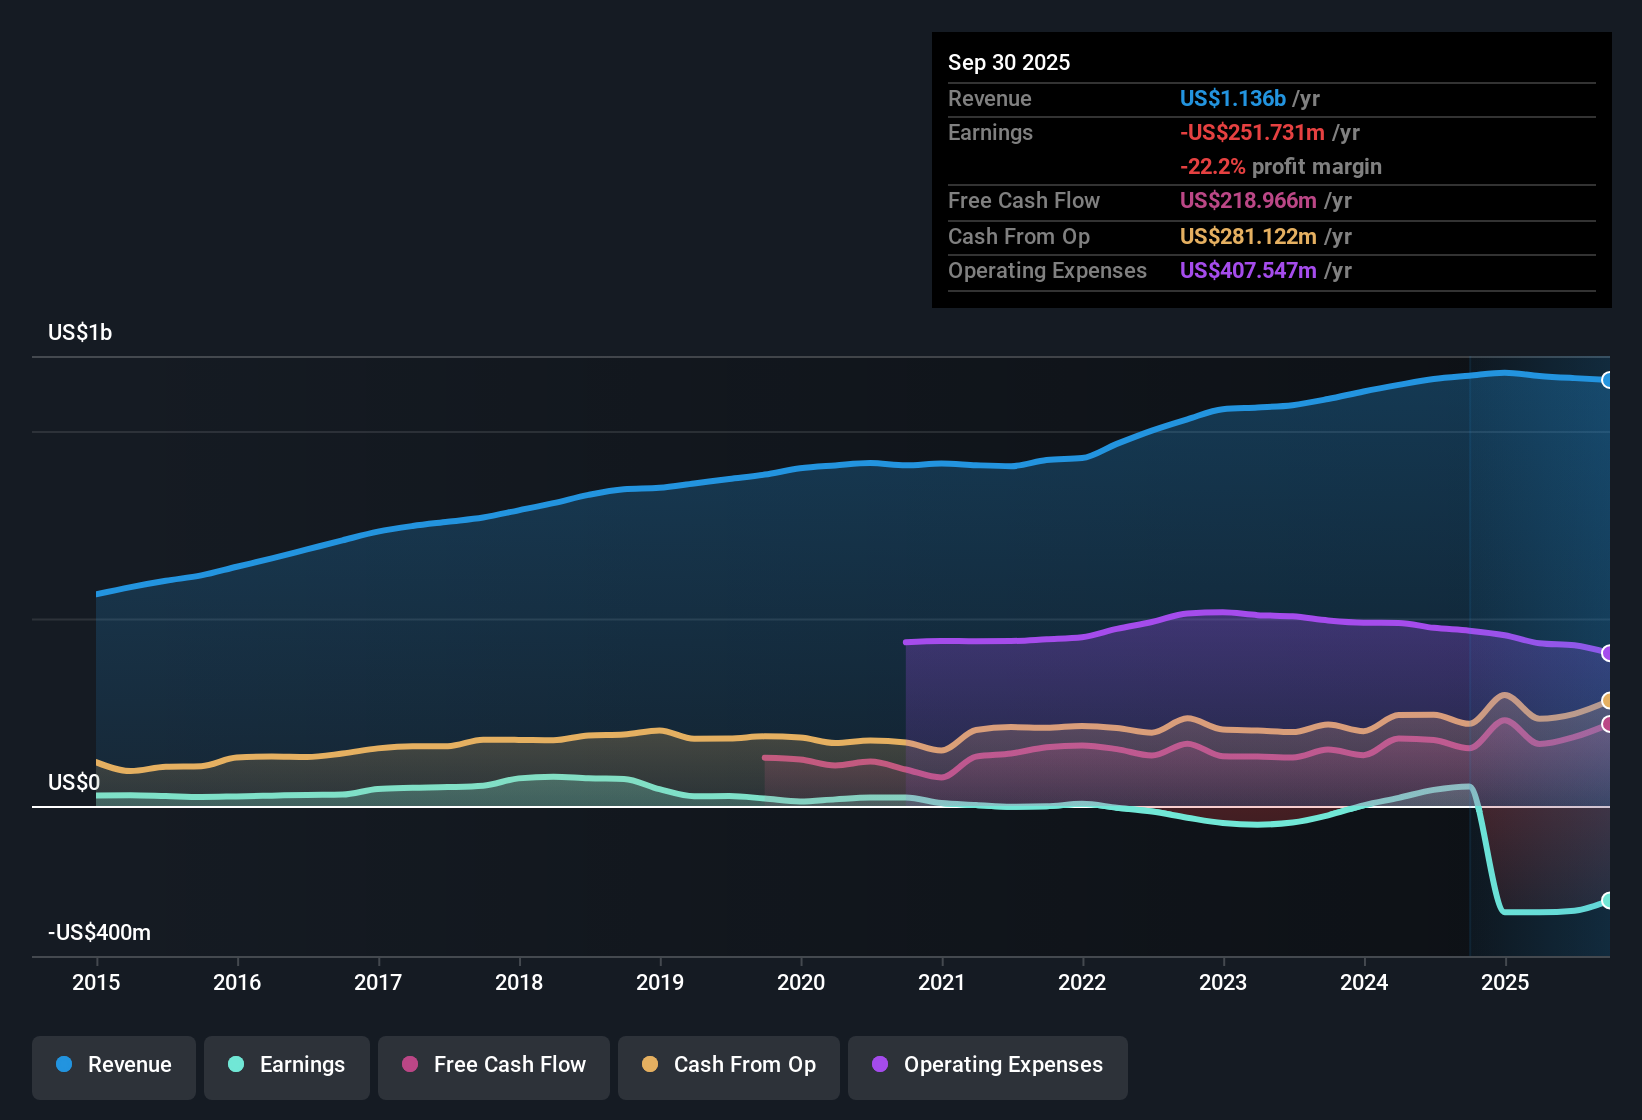
Blackbaud (BLKB) has just closed out FY 2025 with Q4 revenue of US$295.3 million and basic EPS of US$0.78, providing a clear snapshot of where the business now stands after a volatile run of results. Over the past year, the company has seen quarterly revenue move from US$270.7 million in Q1 2025 to US$281.4 million in Q2 and US$281.1 million in Q3. Basic EPS ranged from US$0.10 in Q1 to US$0.54 in Q2 and US$1.00 in Q3, compared with a loss of US$6.74 per share and revenue of US$302.2 million in Q4 2024. With that backdrop, investors are likely to focus on how these reported margins and the path from prior losses shape the risk and reward trade off in the latest numbers.
See our full analysis for Blackbaud.With the headline figures on the table, the next step is to see how this earnings profile lines up against the widely followed narratives about Blackbaud’s growth, profitability path and overall risk reward balance.
Consensus narrative watchers are paying close attention to how a 3.8% growth rate can still support long term earnings expansion and customer stickiness, and how that compares to expectations baked into forecasts and valuation. 📊 Read the full Blackbaud Consensus Narrative.
Bulls argue this mix of a 2x P/S multiple, DCF fair value at US$106.67, and improving quarterly profits could set up a rerating if the profit turnaround holds. 🐂 Blackbaud Bull Case
To see how these results tie into long-term growth, risks, and valuation, check out the full range of community narratives for Blackbaud on Simply Wall St. Add the company to your watchlist or portfolio so you'll be alerted when the story evolves.
See the numbers differently? If this earnings story sparks a different angle for you, shape that view into your own narrative in minutes, Do it your way.
A good starting point is our analysis highlighting 3 key rewards investors are optimistic about regarding Blackbaud.
Blackbaud’s mix of a US$279.4 million trailing loss, five year loss growth of 67.2% per year and slower 3.8% revenue growth highlights meaningful risk.
If that risk profile feels a bit heavy for your portfolio, now is a good time to check out 85 resilient stocks with low risk scores that aim to prioritize resilience and steadier fundamentals.
This article by Simply Wall St is general in nature. We provide commentary based on historical data and analyst forecasts only using an unbiased methodology and our articles are not intended to be financial advice. It does not constitute a recommendation to buy or sell any stock, and does not take account of your objectives, or your financial situation. We aim to bring you long-term focused analysis driven by fundamental data. Note that our analysis may not factor in the latest price-sensitive company announcements or qualitative material. Simply Wall St has no position in any stocks mentioned.
