Blue Owl Capital OWL Quarter Highlights 2.7% Net Margin Compression Challenges Bullish Narratives
Blue Owl Capital Inc. Class A Common Stock OWL | 8.47 8.67 | +0.24% +2.36% Post |
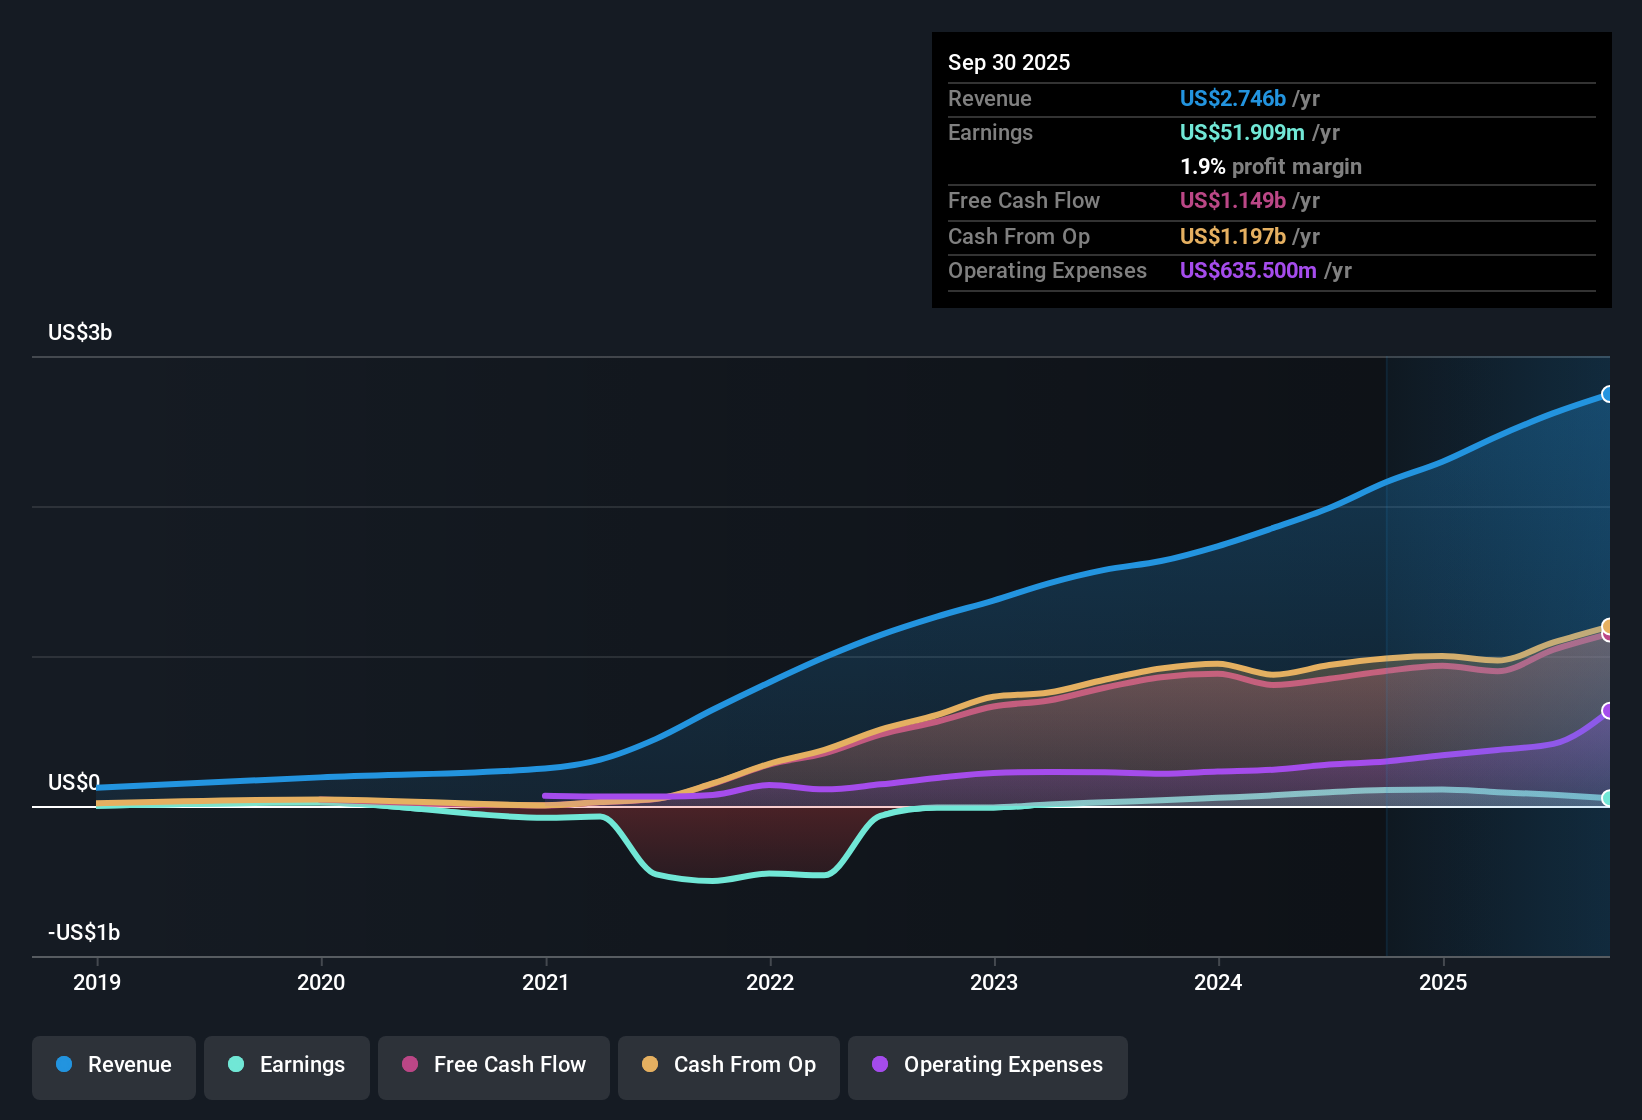
Blue Owl Capital (OWL) closed out FY 2025 with fourth quarter revenue of US$755.6 million and basic EPS of US$0.07, alongside net income of US$47.7 million, putting a clear set of numbers in front of investors watching the story unfold. The company reported revenue of US$600.9 million and EPS of US$0.05 in Q3 2024 and US$755.6 million and EPS of US$0.07 in Q4 2025, while trailing twelve month revenue reached US$2.9 billion and EPS came in at US$0.12. These figures frame a results season focused on how those earnings relate to the company’s margins.
See our full analysis for Blue Owl Capital.With the headline figures on the table, the next step is to compare these results with the widely followed narratives around Blue Owl Capital's growth, profitability and income profile to see which views remain consistent with the data and which may appear stretched.
AUM climbs above US$307 billion
- Blue Owl closed Q4 2025 with US$307.4b of assets under management, up from US$295.6b at the end of Q3 2025 and US$273.3b at the end of Q1 2025, so fee earning capital has been stepping up each quarter.
- What stands out for the bullish view that likes the permanent capital model is that this steady AUM build sits next to trailing 12 month revenue of US$2.9b, while net income over the same period was US$78.8m and the latest quarterly net margin sits inside that 2.7% trailing figure. This keeps the focus on how much of that AUM actually drops through to profits.
2.7% net margin keeps pressure on profits
- On a trailing 12 month basis, net income of US$78.8m on US$2.9b of revenue works out to a 2.7% net margin, compared with 4.8% a year earlier, and Q4 2025 net income of US$47.7m on US$755.6m of revenue sits inside that thinner profitability profile.
- Bears argue that thinner profitability could be a weak spot, and the data offers a mix of support and pushback:
- Trailing net margin moving from 4.8% to 2.7% lines up with that cautious view, as more of every revenue dollar is being absorbed by costs.
- At the same time, trailing 12 month revenue has reached US$2.9b with positive net income, so the business is still profitable even as that margin compression gives critics something concrete to point to.
High P/E and 7.35% yield raise questions
- With the share price at US$12.52, the trailing P/E of 105.6x is much higher than the US Capital Markets industry at 23.1x and the peer average at 26.2x, and that is paired with a 7.35% dividend yield that current earnings and free cash flow are flagged as not fully covering.
- What is striking for the more optimistic take is how the growth outlook is being weighed against those stretched valuation and payout numbers:
- Forecasts for about 11.3% annual revenue growth and roughly 31.9% annual earnings growth align with a bullish argument that the business could grow into some of that premium multiple.
- Set against that, the combination of a very high P/E, a 2.7% trailing net margin and a dividend that is described as not well backed by earnings or free cash flow gives even growth focused investors a concrete checklist of things to monitor in future reports.
Next Steps
Don't just look at this quarter; the real story is in the long-term trend. We've done an in-depth analysis on Blue Owl Capital's growth and its valuation to see if today's price is a bargain. Add the company to your watchlist or portfolio now so you don't miss the next big move.
See What Else Is Out There
Blue Owl Capital pairs a very high 105.6x P/E and a 7.35% dividend yield with a relatively thin 2.7% net margin and dividends not fully covered by earnings or free cash flow.
If those stretched valuation and payout figures make you cautious, you may want to compare them with 53 high quality undervalued stocks that have stronger earnings support and potentially more comfortable pricing right now.
This article by Simply Wall St is general in nature. We provide commentary based on historical data and analyst forecasts only using an unbiased methodology and our articles are not intended to be financial advice. It does not constitute a recommendation to buy or sell any stock, and does not take account of your objectives, or your financial situation. We aim to bring you long-term focused analysis driven by fundamental data. Note that our analysis may not factor in the latest price-sensitive company announcements or qualitative material. Simply Wall St has no position in any stocks mentioned.